Vonage 2008 Annual Report Download - page 35
Download and view the complete annual report
Please find page 35 of the 2008 Vonage annual report below. You can navigate through the pages in the report by either clicking on the pages listed below, or by using the keyword search tool below to find specific information within the annual report.-
 1
1 -
2
-
3
-
4
-
5
-
6
-
7
-
8
-
9
-
10
-
11
-
12
-
13
-
14
-
15
-
16
-
17
-
18
-
19
-
20
-
21
-
22
-
23
-
24
-
 25
25 -
 26
26 -
 27
27 -
 28
28 -
 29
29 -
 30
30 -
 31
31 -
 32
32 -
 33
33 -
 34
34 -
 35
35 -
 36
36 -
 37
37 -
 38
38 -
 39
39 -
 40
40 -
 41
41 -
 42
42 -
 43
43 -
 44
44 -
 45
45 -
46
-
47
-
48
-
49
-
50
-
51
-
52
-
53
-
54
-
55
-
56
-
57
-
58
-
59
-
60
-
61
-
62
-
63
-
64
-
65
-
66
-
67
-
68
-
69
-
70
-
71
-
72
-
73
-
74
-
75
-
76
-
77
-
78
-
79
-
80
-
81
-
82
-
83
-
84
-
85
-
86
-
87
-
88
-
89
-
90
-
91
-
92
-
93
-
94
-
95
-
96
-
97
-
98
-
99
-
100
-
101
-
102
 |
 |

ITEM 7.
M
ana
g
ement’s Discussion and Analysis o
f
Financial
C
ondition and Results of
O
peration
s
Y
ou should read the followin
g
discussion to
g
ether with “
S
elected
F
inancial Data” and our consolidated
f
inancial statements and the
r
e
l
ate
d
notes
i
nc
l
u
d
e
d
e
l
sew
h
ere
i
nt
hi
s
A
nnua
lR
e
p
ort on
F
orm 10-K. This discussion contains forward-lookin
g
statements
,
which involve risks and uncertainties. Our actual results may diffe
r
m
aterially from those we currently anticipate as a result of man
y
factors, includin
g
the factors we describe under “Item 1A—Ris
k
F
actors,” and elsewhere in this Annual Report on Form 10-K.
OVERVIEW
W
e are a leading, pure-play provider o
f
broadband telephone
se
rvi
ces
t
o
r
es
i
de
nti
a
l
a
n
ds
m
a
ll
o
ffi
ce a
n
d
h
o
m
eo
ffi
ce cus
t
o
m
e
r
s
with over 2.6 million subscriber lines as o
f
December 31, 2008
.
W
hile customers in the United States re
p
resented 95% of our
s
u
b
scr
ib
er
li
nes
i
n 2008, we cont
i
nue to serve customers
i
nterna
-
t
ionally with services in Canada and the United Kin
g
dom
.
Our service is portable and we enable our customers to make
and receive phone calls with a telephone almost anywhere
a
b
r
oadba
n
dI
nt
e
rn
e
t
co
nn
ec
t
io
n
is a
v
ailable
.
We
tr
a
n
s
m
i
tt
hese
calls usin
g
Voice over Internet Protocol, or VoIP, technolo
g
y
,
which converts voice signals into digital data packets
f
or trans
-
mission over the Internet. At a cost effective rate, each of our call
-
i
ng plans provides a number o
f
basic
f
eatures typically o
ff
ered by
traditional telephone service providers, plus a wide range of
e
nh
a
n
ced
f
ea
t
u
r
es
th
a
tw
ebe
li
e
v
ed
iff
e
r
e
nti
a
t
eou
r
se
rvi
ce a
n
d
off
er an attractive value proposition to our customers. We als
o
o
ffer a number of
p
remium services for additional costs
.
V
onage has developed both a direct sales channel, as repre-
s
ented by web sites and toll free numbers, and a retail distributio
n
ch
anne
l
t
h
rou
gh
nat
i
ona
l
reta
il
ers
i
nc
l
u
di
n
gB
est
B
uy an
d
Wal-Mart. The direct and retail distribution channels are supported
t
h
roug
hhi
g
hl
y
i
ntegrate
d
a
d
vert
i
s
i
ng campa
i
gns across mu
l
t
i
p
le
me
di
asuc
h
as on
li
ne, te
l
ev
i
s
i
on,
di
rect ma
il
,a
l
ternat
i
ve me
di
a,
telemarketing, partner marketin
g
and customer re
f
erral programs
.
O
ur primar
y
source of revenue is subscription fees that we
c
harge customers
f
or our service plans, primarily on a monthl
y
basis. We also
g
enerate revenue from the sale of devices that
c
onnect a customer’s phone to the Internet,
f
or international call
s
c
ustomers make that are not included in their service
p
lan,
f
or
a
dditional features that customers add to their service
p
lans and
throu
g
h activation
f
ees we char
g
e customers to activate thei
r
service
.
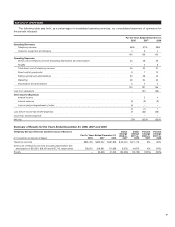
T
rends in
O
ur Industry and Key
O
peratin
g
Dat
a
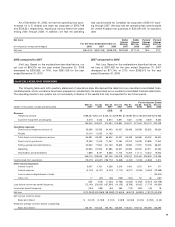
A
number of trends in our industry have a si
g
nificant effect on our results of
operations and are important to an understandin
g
o
f
our
f
inancial statements. Also, the table below includes key operatin
g
data that our
m
anagement uses to measure the growth and operating performance of our business
:
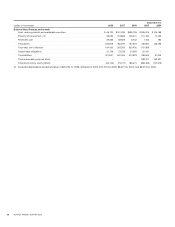
F
or t
h
e
Y
ears
E
n
d
e
dD
ecem
b
er
3
1
,
2008 2007 200
6
G
ross subscriber line addition
s
9
5
2,014 1,1
5
3,218 1,4
7
0,138
N
e
t
subsc
ri
be
r lin
e add
iti
o
n
s
26,929 356,116 955,073
Subscriber lines
(
at
p
eriod end
)
2
,
60
7,
1
5
62
,5
80
,
22
7
2
,
224
,
111
A
verage mont
hl
y customer c
h
urn
3
.1
%
2.8
%
2.5
%
A
vera
g
e monthly revenue per lin
e
$
28.92 $ 28.73 $ 28.9
8
A
verage monthly telephony services revenue per line
$
27.82
$
27.87
$
27.7
6
A
vera
g
e monthly direct cost of telephony services per line $ 7.27 $ 7.52 $ 8.20
Marketing costs per gross subscriber line addition $ 266.14 $ 246.24 $ 248.51
Employees
(
excludin
g
temporary help
)(
at period end
)
1,491 1,543 1,790
B
roa
db
an
d
a
d
o
p
t
i
on
.
T
he number of
U
.
S
. households wit
h
b
roadband Internet access has
g
rown si
g
ni
f
icantly. We expect thi
s
t
rend to continue. We bene
f
it
f
rom this trend because our service
r
e
q
u
i
res a
b
roa
db
an
dI
nternet
c
onnect
i
on an
d
our
p
otent
i
a
l
addressable market increases as broadband adoption increases.
C
han
g
in
g
competitive landscape
.
W
e are facin
g
increasin
g
competition
f
rom other companies that o
ff
er multiple services
s
uch as cable television
,
video services
,
voice and broadband
I
nternet service. These competitors are offerin
g
VoIP or other
v
oice services as part o
f
a bundle, in which the
y
o
ff
er voice serv-
i
ces at a lower price than we do to new subscribers. In addition
,
we believe several of these competitors are working to develo
p
n
ew inte
g
rated o
ff
erin
g
s that we cannot provide and that could
m
ake their services more attractive to customers. For example, a
s
w
ireless
p
roviders offer more minutes at lower
p
rices and com
-
p
an
i
on
l
an
dli
ne a
l
ternat
i
ve serv
i
ces, t
h
e
i
r serv
i
ces
h
ave
b
ecom
e
more attractive to households as a replacement
f
or wireline serv
-
i
ce.
W
ea
l
so compete aga
i
nst esta
bli
s
h
e
d
a
l
ternat
i
ve vo
i
c
e
c
ommun
i
cat
i
on prov
id
ers an
di
n
d
epen
d
ent
V
o
IP
serv
i
ce pro-
v
iders. Some of these service providers ma
y
choose to sacrific
e
revenue in order to gain market share and have offered their serv
-
i
ces at lower prices or for free
.
G
ross subscriber line additions.
G
ross subscriber line addi-
tions for a particular period are calculated by takin
g
the net sub
-
s
criber line additions during that particular period and adding t
o
that the number of subscriber lines that terminated during that
p
er
i
o
d
.
Thi
s num
b
er
d
oes not
i
nc
l
u
d
esu
b
scr
ib
er
li
nes
b
ot
h
a
dd
e
d
a
nd terminated during the period, where termination occurre
d
27