Vonage 2008 Annual Report Download - page 33
Download and view the complete annual report
Please find page 33 of the 2008 Vonage annual report below. You can navigate through the pages in the report by either clicking on the pages listed below, or by using the keyword search tool below to find specific information within the annual report.-
 1
1 -
2
-
3
-
4
-
5
-
6
-
7
-
8
-
9
-
10
-
11
-
12
-
13
-
14
-
15
-
16
-
17
-
18
-
19
-
20
-
21
-
22
-
 23
23 -
 24
24 -
 25
25 -
 26
26 -
 27
27 -
 28
28 -
 29
29 -
 30
30 -
 31
31 -
 32
32 -
 33
33 -
 34
34 -
 35
35 -
 36
36 -
 37
37 -
 38
38 -
 39
39 -
 40
40 -
 41
41 -
 42
42 -
 43
43 -
44
-
45
-
46
-
47
-
48
-
49
-
50
-
51
-
52
-
53
-
54
-
55
-
56
-
57
-
58
-
59
-
60
-
61
-
62
-
63
-
64
-
65
-
66
-
67
-
68
-
69
-
70
-
71
-
72
-
73
-
74
-
75
-
76
-
77
-
78
-
79
-
80
-
81
-
82
-
83
-
84
-
85
-
86
-
87
-
88
-
89
-
90
-
91
-
92
-
93
-
94
-
95
-
96
-
97
-
98
-
99
-
100
-
101
-
102
 |
 |

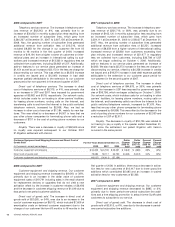
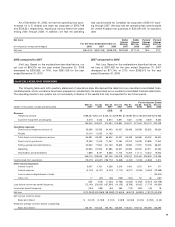
ITEM 6
.
Se
l
ec
t
ed
Fin
a
n
c
i
a
lD
a
t
a
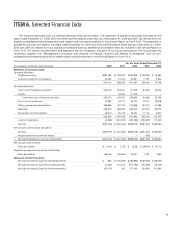
The
f
ollowing table sets
f
orth our selected historical
f
inancial in
f
ormation. The statement o
f
operations and cash
f
low data
f
or the
y
ears ended December 31, 2008, 2007 and 2006 and the balance sheet data as of December 31, 2008 and 2007 are derived from ou
r
audited consolidated financial statements and related notes included elsewhere in this Annual Re
p
ort on Form 10-K. The statement o
f
operations and cash
f
low data
f
or the
y
ears ended December 31, 2005 and 2004 and the balance sheet data as o
f
December 31, 2006
,
2005 and 2004 are derived from our audited consolidated financial statements and related notes not included in this Annual Re
p
ort o
n
Form 10-K. The results included below and elsewhere are not necessarily indicative of our future performance. You should read this
i
nformation to
g
ether with “Mana
g
ement’s Discussion and Analysis of Financial Condition and Results of Operations” and our con-
s
olidated
f
inancial statements and the related notes included elsewhere in this Annual Re
p
ort on Form 10-K.
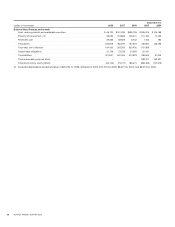
For the Years Ended December 31
,
(
in thousands, except per share amounts
)
2008 200
7
2006 200
5
2004
S
tatement of
O
perations Data:
Operatin
g
Revenues:
T
elephony services
$
865,765
$
803,522
$
581,806
$
258,165
$
75,864
C
ustomer equipment and shippin
g
34,355 24,706 25,591 11,031 3,844
900
,
120 828
,
228 607
,
397 269
,
196 79
,
708
O
perating Expenses:
Direct cost of telephon
y
services
(
1
)
226,210 216,831 171,958 84,050 23,209
R
o
y
a
l
t
y
–32
,
606 51
,
345 – –
Total direct cost of telephon
y
services 226,210 249,437 223,303 84,050 23,209
Direct cost of goods sold 79,382 59,117 62,730 40,441 18,878
S
elling, general and administrative 298,985 461,768 272,826 154,716 49,18
6
M
ar
k
et
i
ng
2
5
3,3
7
0 283,968 36
5
,349 243,404
5
6,0
7
5
D
eprec
i
at
i
on an
d
amort
i
zat
i
on 48,612 35,718 23,677 11,122 3,907
906,
55
9 1,090,008 94
7
,88
55
33,
7
33 1
5
1,2
5
5
L
oss from operations (6,439) (261,780) (340,488) (264,537) (71,547
)
N
et
l
os
s
$
(64,576) $ (267,428) $(338,573) $(261,334) $ (69,921
)
N
et
l
oss per common s
h
are ca
l
cu
l
at
i
on
:
N
et
l
os
s
$
(64,576) $ (267,428) $(338,573) $(261,334) $ (69,921
)
Imputed dividend on preferred shares – – –
(
605
)
–
Net loss attributable to common shareholders $ (64,576) $ (267,428) $(338,573) $(261,939) $ (69,921
)
Net loss
p
er common share
:
B
asic and diluted $
(
0.41
)
$
(
1.72
)
$
(
3.59
)
$
(
189.67
)
$
(
51.41
)
W
e
igh
te
d
-avera
g
e common s
h
ares outstan
di
n
g
:
Basic a
n
d dilu
t
ed
1
5
6
,
2
5
81
55,5
93 94
,
20
7
1
,
381 1
,
360
Statement of Cash Flow Data
:
Net cash provided by (used in) operatin
g
activities
$
655
$
(270,926)
$
(188,898)
$
(189,765)
$
(38,600)
Net cash provided by
(
used in
)
investin
g
activities 40,486 131,457
(
210,798
)(
154,638
)(
73,707
)
Net cash provided by
(
used in
)
financin
g
activities
(
65,470
)
245 477,429 434,006 141,09
4
2
5