U-Haul 2005 Annual Report Download - page 93
Download and view the complete annual report
Please find page 93 of the 2005 U-Haul annual report below. You can navigate through the pages in the report by either clicking on the pages listed below, or by using the keyword search tool below to find specific information within the annual report.-
 1
1 -
2
-
3
-
4
-
5
-
6
-
7
-
8
-
9
-
10
-
11
-
12
-
13
-
14
-
15
-
16
-
17
-
18
-
19
-
20
-
21
-
22
-
23
-
24
-
25
-
26
-
27
-
28
-
29
-
30
-
31
-
32
-
33
-
34
-
35
-
36
-
37
-
38
-
39
-
40
-
41
-
42
-
43
-
44
-
45
-
46
-
47
-
48
-
49
-
50
-
51
-
52
-
53
-
54
-
55
-
56
-
57
-
58
-
59
-
60
-
61
-
62
-
63
-
64
-
65
-
66
-
67
-
68
-
69
-
70
-
71
-
72
-
73
-
74
-
75
-
76
-
77
-
78
-
79
-
80
-
81
-
82
-
 83
83 -
 84
84 -
 85
85 -
 86
86 -
 87
87 -
 88
88 -
 89
89 -
 90
90 -
 91
91 -
 92
92 -
 93
93 -
 94
94 -
 95
95 -
 96
96 -
 97
97 -
 98
98 -
 99
99 -
 100
100 -
 101
101 -
 102
102 -
 103
103
 |
 |

92 I AMERCO ANNUAL REPORT
Amerco and Consolidated Entities
Notes to Consolidated Financial Statements, continued
F-51
AMERCO AND CONSOLIDATED ENTITIES
NOTES TO CONSOLIDATED FINANCIAL STATEMENTS Ì (Continued)
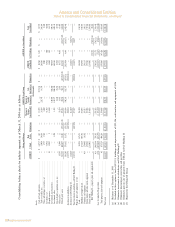
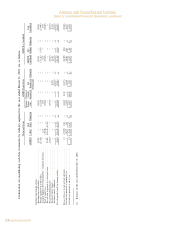
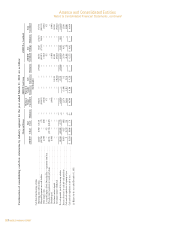
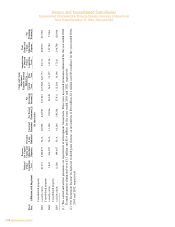
Continuation of consolidating cash flow statements by industry segment for the year ended March 31, 2003 are as follow:
Moving and Storage AMERCO Legal Group AMERCO as Consolidated
Moving & Property &
Real Storage Casualty Life AMERCO SAC Total
AMERCO U-Haul Estate Elimination Consolidated Insurance(a) Insurance(a) Elimination Consolidated Holdings Elimination Consolidated
(In thousands)
Cash flows from financing activities:
Borrowings from credit facilities ÏÏÏÏÏÏÏÏÏÏÏÏÏÏÏÏÏÏÏÏÏÏÏÏÏÏÏÏÏÏÏÏÏÏÏÏÏÏÏ 262,007 16,900 101,329 Ì 380,236 Ì Ì (39,500) 340,736 58,827 (27,827) 371,736
Principal Repayments on credit facilities ÏÏÏÏÏÏÏÏÏÏÏÏÏÏÏÏÏÏÏÏÏÏÏÏÏÏÏÏÏÏÏÏ (433,788) Ì (27) Ì (433,815) Ì Ì Ì (433,815) (37,135) 28,838 (442,112)
Debt issuance costs ÏÏÏÏÏÏÏÏÏÏÏÏÏÏÏÏÏÏÏÏÏÏÏÏÏÏÏÏÏÏÏÏÏÏÏÏÏÏÏÏÏÏÏÏÏÏÏÏÏÏ (2,330) Ì (680) Ì (3,010) Ì Ì Ì (3,010) Ì Ì (3,010)
Leveraged Employee Stock Ownership Plan Ì repayments from loanÏÏÏÏÏÏÏÏ Ì 975 Ì Ì 975 Ì Ì Ì 975 Ì Ì 975
Proceeds from (repayment of) related party loans ÏÏÏÏÏÏÏÏÏÏÏÏÏÏÏÏÏÏÏÏÏÏÏÏ 330,735 (227,316) (103,419) Ì Ì Ì Ì Ì Ì Ì Ì Ì
Dividends paid ÏÏÏÏÏÏÏÏÏÏÏÏÏÏÏÏÏÏÏÏÏÏÏÏÏÏÏÏÏÏÏÏÏÏÏÏÏÏÏÏÏÏÏÏÏÏÏÏÏÏÏÏÏÏ (6,480) Ì Ì Ì (6,480) Ì Ì Ì (6,480) Ì Ì (6,480)
Investment contract deposits ÏÏÏÏÏÏÏÏÏÏÏÏÏÏÏÏÏÏÏÏÏÏÏÏÏÏÏÏÏÏÏÏÏÏÏÏÏÏÏÏÏÏ Ì Ì Ì Ì Ì Ì 165,281 Ì 165,281 Ì Ì 165,281
Investment contract withdrawals ÏÏÏÏÏÏÏÏÏÏÏÏÏÏÏÏÏÏÏÏÏÏÏÏÏÏÏÏÏÏÏÏÏÏÏÏÏÏÏ Ì Ì Ì Ì Ì Ì (98,022) Ì (98,022) Ì Ì (98,022)
Net cash provided (used) by financing activities ÏÏÏÏÏÏÏÏÏÏÏÏÏÏÏÏÏÏÏÏÏÏÏÏÏÏÏ 150,144 (209,441) (2,797) Ì (62,094) Ì 67,259 (39,500) (34,335) 21,692 1,011 (11,632)
Increase (decrease) in cash and cash equivalents ÏÏÏÏÏÏÏÏÏÏÏÏÏÏÏÏÏÏÏÏÏÏÏÏÏÏÏ 18,453 4,327 (402) Ì 22,378 (1,804) 162 Ì 20,736 4,652 Ì 25,388
Cash and cash equivalents at beginning of year ÏÏÏÏÏÏÏÏÏÏÏÏÏÏÏÏÏÏÏÏÏÏÏÏÏÏÏÏ 71 25,719 576 Ì 26,366 5,912 9,158 Ì 41,436 10 Ì 41,446
Cash and cash equivalents at end of yearÏÏÏÏÏÏÏÏÏÏÏÏÏÏÏÏÏÏÏÏÏÏÏÏÏÏÏÏÏÏÏÏÏÏ $ 18,524 $ 30,046 $ 174 $Ì $ 48,744 $ 4,108 $ 9,320 $ Ì $ 62,172 $ 4,662 $ Ì $ 66,834
(a) Balance for the year ended December 31, 2002