U-Haul 2005 Annual Report Download - page 86
Download and view the complete annual report
Please find page 86 of the 2005 U-Haul annual report below. You can navigate through the pages in the report by either clicking on the pages listed below, or by using the keyword search tool below to find specific information within the annual report.-
 1
1 -
2
-
3
-
4
-
5
-
6
-
7
-
8
-
9
-
10
-
11
-
12
-
13
-
14
-
15
-
16
-
17
-
18
-
19
-
20
-
21
-
22
-
23
-
24
-
25
-
26
-
27
-
28
-
29
-
30
-
31
-
32
-
33
-
34
-
35
-
36
-
37
-
38
-
39
-
40
-
41
-
42
-
43
-
44
-
45
-
46
-
47
-
48
-
49
-
50
-
51
-
52
-
53
-
54
-
55
-
56
-
57
-
58
-
59
-
60
-
61
-
62
-
63
-
64
-
65
-
66
-
67
-
68
-
69
-
70
-
71
-
72
-
73
-
74
-
75
-
 76
76 -
 77
77 -
 78
78 -
 79
79 -
 80
80 -
 81
81 -
 82
82 -
 83
83 -
 84
84 -
 85
85 -
 86
86 -
 87
87 -
 88
88 -
 89
89 -
 90
90 -
 91
91 -
 92
92 -
 93
93 -
 94
94 -
 95
95 -
 96
96 -
97
-
98
-
99
-
100
-
101
-
102
-
103
 |
 |

85 I AMERCO ANNUAL REPORT
Amerco and Consolidated Entities
Notes to Consolidated Financial Statements, continued
F-44
AMERCO AND CONSOLIDATED ENTITIES
NOTES TO CONSOLIDATED FINANCIAL STATEMENTS Ì (Continued)
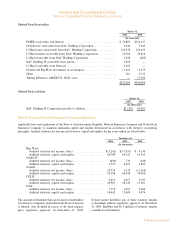
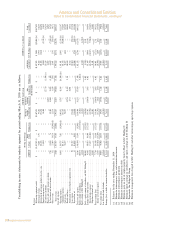
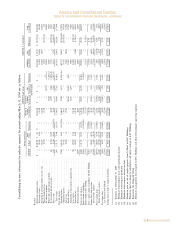
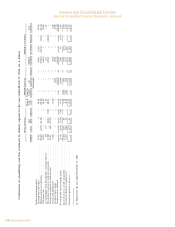
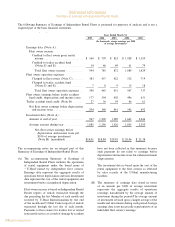
Consolidating income statements by industry segment for period ending March 31, 2004 are as follows:
AMERCO Legal Group AMERCO as Consolidated
Moving and Storage Moving & Property &
Real Storage Casualty Life AMERCO SAC Total
AMERCO U-Haul Estate Eliminations Consolidated(g) Insurance(a) Insurance(a) Eliminations Consolidated Holdings Eliminations Consolidated
(In thousands)
Revenues:
Self-moving equipment rentals ÏÏÏÏÏÏÏÏÏÏÏÏÏÏÏÏÏÏÏÏÏÏÏÏÏÏ $ Ì $1,380,991 $ 217 $ Ì $1,381,208 $ Ì $ Ì $ Ì $1,381,208 $ 29,155 $ (29,155)(b) $1,381,208
Self-storage revenues ÏÏÏÏÏÏÏÏÏÏÏÏÏÏÏÏÏÏÏÏÏÏÏÏÏÏÏÏÏÏÏÏÏÏ Ì 118,335 2,869 Ì 121,204 Ì Ì Ì 121,204 126,436 Ì 247,640
Self-moving & self-storage products & service salesÏÏÏÏÏÏÏÏÏ Ì 182,327 61 Ì 182,388 Ì Ì Ì 182,388 50,577 Ì 232,965
Property management feesÏÏÏÏÏÏÏÏÏÏÏÏÏÏÏÏÏÏÏÏÏÏÏÏÏÏÏÏÏÏ Ì 12,974 Ì Ì 12,974 Ì Ì Ì 12,974 Ì (12,715)(h) 259
Life insurance premiums ÏÏÏÏÏÏÏÏÏÏÏÏÏÏÏÏÏÏÏÏÏÏÏÏÏÏÏÏÏÏÏ Ì Ì Ì Ì Ì Ì 147,753 (2,671)(c) 145,082 Ì 145,082
Property and casualty insurance premiums ÏÏÏÏÏÏÏÏÏÏÏÏÏÏÏÏ Ì Ì Ì Ì Ì 93,242 Ì (1,206)(c) 92,036 Ì Ì 92,036
Net investment and interest income ÏÏÏÏÏÏÏÏÏÏÏÏÏÏÏÏÏÏÏÏÏÏ 866 21,504 16,089 Ì 38,459 21,699 19,046 (4,088)(d) 75,116 Ì (36,835)(d) 38,281
Other revenue ÏÏÏÏÏÏÏÏÏÏÏÏÏÏÏÏÏÏÏÏÏÏÏÏÏÏÏÏÏÏÏÏÏÏÏÏÏÏÏÏ 1,550 35,580 56,668 (61,159)(b) 32,639 Ì 11,013 (2,497)(b) 41,155 12,787 (15,419)(b) 38,523
Total revenues ÏÏÏÏÏÏÏÏÏÏÏÏÏÏÏÏÏÏÏÏÏÏÏÏÏÏÏÏÏÏÏÏÏÏÏÏÏÏ 2,416 1,751,711 75,904 (61,159) 1,768,872 114,941 177,812 (10,462) 2,051,163 218,955 (94,124) 2,175,994
Costs and expenses:
Operating expenses ÏÏÏÏÏÏÏÏÏÏÏÏÏÏÏÏÏÏÏÏÏÏÏÏÏÏÏÏÏÏÏÏÏÏÏÏ 37,080 1,062,695 8,063 (61,159)(b) 1,046,679 27,403 38,111 (15,056)(b,c) 1,097,137 108,412 (25,553)(b,h) 1,179,996
Commission expenses ÏÏÏÏÏÏÏÏÏÏÏÏÏÏÏÏÏÏÏÏÏÏÏÏÏÏÏÏÏÏÏÏÏÏ Ì 176,165 Ì Ì 176,165 Ì Ì Ì 176,165 Ì (29,155)(b) 147,010
Cost of sales ÏÏÏÏÏÏÏÏÏÏÏÏÏÏÏÏÏÏÏÏÏÏÏÏÏÏÏÏÏÏÏÏÏÏÏÏÏÏÏÏÏ Ì 87,430 26 Ì 87,456 Ì Ì Ì 87,456 24,450 Ì 111,906
Benefits and losses ÏÏÏÏÏÏÏÏÏÏÏÏÏÏÏÏÏÏÏÏÏÏÏÏÏÏÏÏÏÏÏÏÏÏÏÏ Ì Ì Ì Ì Ì 109,362 103,491 4,594 217,447 Ì Ì 217,447
Amortization of deferred policy acquisition costs ÏÏÏÏÏÏÏÏÏÏÏ Ì Ì Ì Ì Ì 14,126 24,957 Ì 39,083 Ì Ì 39,083
Lease expense ÏÏÏÏÏÏÏÏÏÏÏÏÏÏÏÏÏÏÏÏÏÏÏÏÏÏÏÏÏÏÏÏÏÏÏÏÏÏÏÏ 786 159,869 2,653 Ì 163,308 Ì Ì Ì 163,308 Ì (2,581)(b) 160,727
Depreciation, netÏÏÏÏÏÏÏÏÏÏÏÏÏÏÏÏÏÏÏÏÏÏÏÏÏÏÏÏÏÏÏÏÏÏÏÏÏÏ 39 125,093 4,209 Ì 129,341 Ì Ì Ì 129,341 21,400 (1,928)(e) 148,813
Restructuring expensesÏÏÏÏÏÏÏÏÏÏÏÏÏÏÏÏÏÏÏÏÏÏÏÏÏÏÏÏÏÏÏÏÏ 44,097 Ì Ì Ì 44,097 Ì Ì Ì 44,097 Ì Ì 44,097
Total costs and expenses ÏÏÏÏÏÏÏÏÏÏÏÏÏÏÏÏÏÏÏÏÏÏÏÏÏÏÏÏÏÏÏÏÏ 82,002 1,611,252 14,951 (61,159) 1,647,046 150,891 166,559 (10,462) 1,954,034 154,262 (59,217) 2,049,079
Equity earnings of subsidiaries ÏÏÏÏÏÏÏÏÏÏÏÏÏÏÏÏÏÏÏÏÏÏÏÏÏÏÏÏ 98,368 Ì Ì (115,050)(f) (16,682) Ì Ì 16,682(f) Ì Ì Ì Ì
Equity earnings of SAC HoldingsÏÏÏÏÏÏÏÏÏÏÏÏÏÏÏÏÏÏÏÏÏÏÏÏÏÏ (11,551) Ì Ì Ì (11,551) Ì Ì Ì (11,551) Ì 11,551(f) Ì
Total Ì equity earnings of subsidiaries and SAC HoldingsÏÏÏÏÏ 86,817 Ì Ì (115,050) (28,233) Ì Ì 16,682 (11,551) Ì 11,551 Ì
Earnings (loss) from operations ÏÏÏÏÏÏÏÏÏÏÏÏÏÏÏÏÏÏÏÏÏÏÏÏÏÏÏ 7,231 140,459 60,953 (115,050) 93,593 (35,950) 11,253 16,682 85,578 64,693 (23,356) 126,915
Interest income (expense)ÏÏÏÏÏÏÏÏÏÏÏÏÏÏÏÏÏÏÏÏÏÏÏÏÏÏÏÏÏÏ (56,968) 8,560 (29,154) Ì (77,562) Ì Ì Ì (77,562) (80,963) 36,835(d) (121,690)
Pretax earnings (loss) ÏÏÏÏÏÏÏÏÏÏÏÏÏÏÏÏÏÏÏÏÏÏÏÏÏÏÏÏÏÏÏÏÏÏÏ (49,737) 149,019 31,799 (115,050) 16,031 (35,950) 11,253 16,682 8,016 (16,270) 13,479 5,225
Income tax benefit (expense) ÏÏÏÏÏÏÏÏÏÏÏÏÏÏÏÏÏÏÏÏÏÏÏÏÏÏÏ 45,690 (52,992) (12,776) Ì (20,078) 12,508 (4,493) Ì (12,063) 4,719 (733) (8,077)
Net earnings (loss)ÏÏÏÏÏÏÏÏÏÏÏÏÏÏÏÏÏÏÏÏÏÏÏÏÏÏÏÏÏÏÏÏÏÏÏÏÏÏ (4,047) 96,027 19,023 (115,050) (4,047) (23,442) 6,760 16,682 (4,047) (11,551) 12,746 (2,852)
Less: Preferred stock dividends ÏÏÏÏÏÏÏÏÏÏÏÏÏÏÏÏÏÏÏÏÏÏÏÏÏÏ (12,963) Ì Ì Ì (12,963) Ì Ì Ì (12,963) Ì Ì (12,963)
Earnings (loss) available to common shareholdersÏÏÏÏÏÏÏÏÏÏÏÏ $(17,010) $ 96,027 $ 19,023 $(115,050) $ (17,010) $(23,442) $ 6,760 $ 16,682 $ (17,010) $(11,551) $ 12,746 $ (15,815)
(a) Balances as of December 31, 2003
(b) Eliminate intercompany lease and commission income
(c) Eliminate intercompany premiums
(d) Eliminate intercompany interest on debt
(e) Eliminate gain on sale of surplus property from U-Haul to SAC Holdings
(f) Eliminate equity earnings in subsidiaries and equity earnings in SAC Holdings
(g) Represents the Obligated Group
(h) Eliminate management fees charged to SAC Holdings and other intercompany operating expenses