U-Haul 2005 Annual Report Download - page 61
Download and view the complete annual report
Please find page 61 of the 2005 U-Haul annual report below. You can navigate through the pages in the report by either clicking on the pages listed below, or by using the keyword search tool below to find specific information within the annual report.-
 1
1 -
2
-
3
-
4
-
5
-
6
-
7
-
8
-
9
-
10
-
11
-
12
-
13
-
14
-
15
-
16
-
17
-
18
-
19
-
20
-
21
-
22
-
23
-
24
-
25
-
26
-
27
-
28
-
29
-
30
-
31
-
32
-
33
-
34
-
35
-
36
-
37
-
38
-
39
-
40
-
41
-
42
-
43
-
44
-
45
-
46
-
47
-
48
-
49
-
50
-
 51
51 -
 52
52 -
 53
53 -
 54
54 -
 55
55 -
 56
56 -
 57
57 -
 58
58 -
 59
59 -
 60
60 -
 61
61 -
 62
62 -
 63
63 -
 64
64 -
 65
65 -
 66
66 -
 67
67 -
 68
68 -
 69
69 -
 70
70 -
 71
71 -
72
-
73
-
74
-
75
-
76
-
77
-
78
-
79
-
80
-
81
-
82
-
83
-
84
-
85
-
86
-
87
-
88
-
89
-
90
-
91
-
92
-
93
-
94
-
95
-
96
-
97
-
98
-
99
-
100
-
101
-
102
-
103
 |
 |

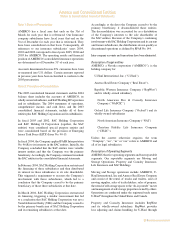
60 I AMERCO ANNUAL REPORT
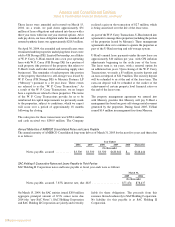
Expected maturities may differ from contractual
maturities as borrowers may have the right to call or
prepay obligations with or without call or prepayment
penalties.
The company deposits bonds with insurance regulatory
authoritiestomeetstatutoryrequirements.Theadjusted
cost of bonds on deposit with insurance regulatory
authoritieswas$12.9millionatDecember31,2004and
$12.9millionatDecember31,2003.
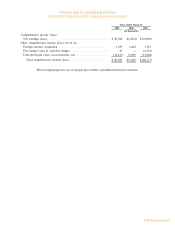
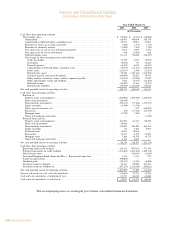
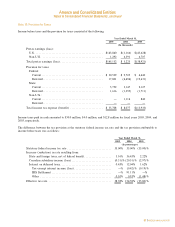
AMERCO AND CONSOLIDATED ENTITIES
NOTES TO CONSOLIDATED FINANCIAL STATEMENTS Ì (Continued)
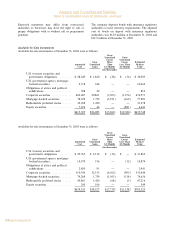
Available-for-Sale Investments
Available-for-sale investments at December 31, 2004 were as follows:
Gross
Unrealized Gross
Losses Unrealized
Gross More Losses Estimated
Amortized Unrealized Than Less Than Market
Cost Gains 12 Months 12 Months Value
(In thousands)
U.S. treasury securities and
government obligations ÏÏÏÏÏÏÏÏÏÏ $ 28,249 $ 1,840 $ (28) $ (56) $ 30,005
U.S. government agency mortgage-
backed securities ÏÏÏÏÏÏÏÏÏÏÏÏÏÏÏ 9,718 344 Ì Ì 10,062
Obligations of states and political
subdivisions ÏÏÏÏÏÏÏÏÏÏÏÏÏÏÏÏÏÏÏ 788 22 Ì Ì 810
Corporate securities ÏÏÏÏÏÏÏÏÏÏÏÏÏÏ 460,687 20,861 (3,303) (1,274) 476,971
Mortgage-backed securities ÏÏÏÏÏÏÏÏ 78,329 1,752 (1,931) (169) 77,981
Redeemable preferred stocks ÏÏÏÏÏÏÏ 30,058 1,220 Ì Ì 31,278
Equity securities ÏÏÏÏÏÏÏÏÏÏÏÏÏÏÏÏÏ 7,476 46 Ì (881) 6,641
$615,305 $26,085 $(5,262) $(2,380) $633,748
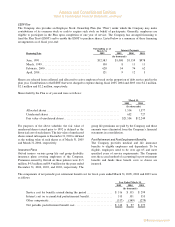
Available-for-sale investments at December 31, 2003 were as follows:
Gross
Unrealized Gross
Losses Unrealized
Gross More Losses Estimated
Amortized Unrealized Than Less Than Market
Cost Gains 12 Months 12 Months Value
(In thousands)
U.S. treasury securities and
government obligations ÏÏÏÏÏÏÏÏÏÏ $ 29,765 $ 2,134 $ (36) $ Ì $ 31,863
U.S. government agency mortgage-
backed securities ÏÏÏÏÏÏÏÏÏÏÏÏÏÏÏ 10,570 316 Ì (12) 10,874
Obligations of states and political
subdivisions ÏÏÏÏÏÏÏÏÏÏÏÏÏÏÏÏÏÏÏ 2,850 91 Ì Ì 2,941
Corporate securities ÏÏÏÏÏÏÏÏÏÏÏÏÏÏ 510,596 32,515 (6,562) (905) 535,644
Mortgage-backed securities ÏÏÏÏÏÏÏÏ 74,268 1,739 (1,053) (318) 74,636
Redeemable preferred stocks ÏÏÏÏÏÏÏ 45,861 1,426 (68) (3) 47,216
Equity securities ÏÏÏÏÏÏÏÏÏÏÏÏÏÏÏÏÏ 243 106 Ì Ì 349
$674,153 $38,327 $(7,719) $(1,238) $703,523
The Company sold available-for-sale securities with a fair value of $167.5 million in 2004, $267.9 million
in 2003 and $248.0 million in 2002. The gross realized gains on these sales totaled $2.3 million in 2004,
$5.3 million in 2003 and $6.0 million in 2002. The company realized gross losses on these sales of $1.7 million
in 2004, $3.1 million in 2003 and $2.4 million in 2002. The company recognized a write-down of investments
due to other than temporary declines on available-for-sale investments of approximately $4.3 million in 2004,
$5.0 million in 2003 and $9.8 million in 2002. The unrealized losses presented in the tables above that are
more than 12 months are considered temporary declines. The Company tracks each of these investments and
evaluates them on an individual basis for other than temporary declines including obtaining corroborating
F-17
AMERCO AND CONSOLIDATED ENTITIES
NOTES TO CONSOLIDATED FINANCIAL STATEMENTS Ì (Continued)
Available-for-Sale Investments
Available-for-sale investments at December 31, 2004 were as follows:
Gross
Unrealized Gross
Losses Unrealized
Gross More Losses Estimated
Amortized Unrealized Than Less Than Market
Cost Gains 12 Months 12 Months Value
(In thousands)
U.S. treasury securities and
government obligations ÏÏÏÏÏÏÏÏÏÏ $ 28,249 $ 1,840 $ (28) $ (56) $ 30,005
U.S. government agency mortgage-
backed securities ÏÏÏÏÏÏÏÏÏÏÏÏÏÏÏ 9,718 344 Ì Ì 10,062
Obligations of states and political
subdivisions ÏÏÏÏÏÏÏÏÏÏÏÏÏÏÏÏÏÏÏ 788 22 Ì Ì 810
Corporate securities ÏÏÏÏÏÏÏÏÏÏÏÏÏÏ 460,687 20,861 (3,303) (1,274) 476,971
Mortgage-backed securities ÏÏÏÏÏÏÏÏ 78,329 1,752 (1,931) (169) 77,981
Redeemable preferred stocks ÏÏÏÏÏÏÏ 30,058 1,220 Ì Ì 31,278
Equity securities ÏÏÏÏÏÏÏÏÏÏÏÏÏÏÏÏÏ 7,476 46 Ì (881) 6,641
$615,305 $26,085 $(5,262) $(2,380) $633,748
Available-for-sale investments at December 31, 2003 were as follows:
Gross
Unrealized Gross
Losses Unrealized
Gross More Losses Estimated
Amortized Unrealized Than Less Than Market
Cost Gains 12 Months 12 Months Value
(In thousands)
U.S. treasury securities and
government obligations ÏÏÏÏÏÏÏÏÏÏ $ 29,765 $ 2,134 $ (36) $ Ì $ 31,863
U.S. government agency mortgage-
backed securities ÏÏÏÏÏÏÏÏÏÏÏÏÏÏÏ 10,570 316 Ì (12) 10,874
Obligations of states and political
subdivisions ÏÏÏÏÏÏÏÏÏÏÏÏÏÏÏÏÏÏÏ 2,850 91 Ì Ì 2,941
Corporate securities ÏÏÏÏÏÏÏÏÏÏÏÏÏÏ 510,596 32,515 (6,562) (905) 535,644
Mortgage-backed securities ÏÏÏÏÏÏÏÏ 74,268 1,739 (1,053) (318) 74,636
Redeemable preferred stocks ÏÏÏÏÏÏÏ 45,861 1,426 (68) (3) 47,216
Equity securities ÏÏÏÏÏÏÏÏÏÏÏÏÏÏÏÏÏ 243 106 Ì Ì 349
$674,153 $38,327 $(7,719) $(1,238) $703,523
The Company sold available-for-sale securities with a fair value of $167.5 million in 2004, $267.9 million
in 2003 and $248.0 million in 2002. The gross realized gains on these sales totaled $2.3 million in 2004,
$5.3 million in 2003 and $6.0 million in 2002. The company realized gross losses on these sales of $1.7 million
in 2004, $3.1 million in 2003 and $2.4 million in 2002. The company recognized a write-down of investments
due to other than temporary declines on available-for-sale investments of approximately $4.3 million in 2004,
$5.0 million in 2003 and $9.8 million in 2002. The unrealized losses presented in the tables above that are
more than 12 months are considered temporary declines. The Company tracks each of these investments and
evaluates them on an individual basis for other than temporary declines including obtaining corroborating
F-17
Amerco and Consolidated Entities
Notes to Consolidated Financial Statements, continued
Available-for-Sale Investments
Available-for-saleinvestmentsatDecember31,2004wereasfollows:
Available-for-saleinvestmentsatDecember31,2003wereasfollows: