U-Haul 2005 Annual Report Download - page 82
Download and view the complete annual report
Please find page 82 of the 2005 U-Haul annual report below. You can navigate through the pages in the report by either clicking on the pages listed below, or by using the keyword search tool below to find specific information within the annual report.-
 1
1 -
2
-
3
-
4
-
5
-
6
-
7
-
8
-
9
-
10
-
11
-
12
-
13
-
14
-
15
-
16
-
17
-
18
-
19
-
20
-
21
-
22
-
23
-
24
-
25
-
26
-
27
-
28
-
29
-
30
-
31
-
32
-
33
-
34
-
35
-
36
-
37
-
38
-
39
-
40
-
41
-
42
-
43
-
44
-
45
-
46
-
47
-
48
-
49
-
50
-
51
-
52
-
53
-
54
-
55
-
56
-
57
-
58
-
59
-
60
-
61
-
62
-
63
-
64
-
65
-
66
-
67
-
68
-
69
-
70
-
71
-
 72
72 -
 73
73 -
 74
74 -
 75
75 -
 76
76 -
 77
77 -
 78
78 -
 79
79 -
 80
80 -
 81
81 -
 82
82 -
 83
83 -
 84
84 -
 85
85 -
 86
86 -
 87
87 -
 88
88 -
 89
89 -
 90
90 -
 91
91 -
 92
92 -
93
-
94
-
95
-
96
-
97
-
98
-
99
-
100
-
101
-
102
-
103
 |
 |

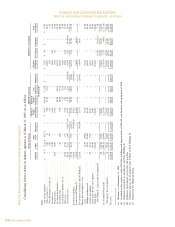
81 I AMERCO ANNUAL REPORT
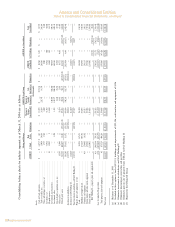
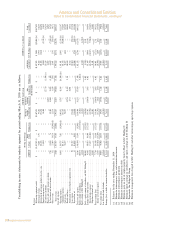
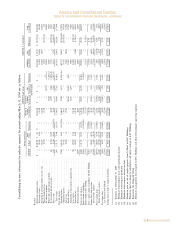
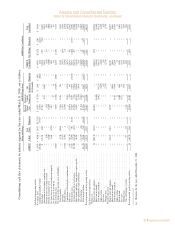
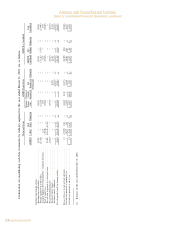
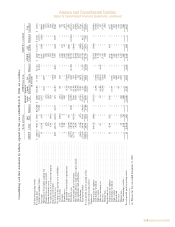
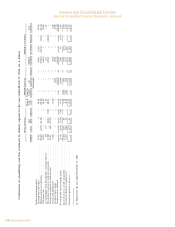
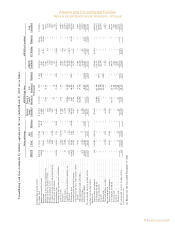
Amerco and Consolidated Entities
Notes to Consolidated Financial Statements, continued
F-40
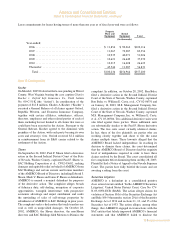
AMERCO AND CONSOLIDATED ENTITIES
NOTES TO CONSOLIDATED FINANCIAL STATEMENTS Ì (Continued)
Consolidating balance sheets by industry segment as of March 31, 2005 are as follows:
Moving and Storage AMERCO Legal Group AMERCO as Consolidated
Moving & Property &
Real Storage Casualty Life AMERCO Total
AMERCO U-Haul Estate Eliminations Consolidated(e) Insurance(a) Insurance(a) Eliminations Consolidated SAC Holdings Eliminations Consolidated
(In thousands)
Liabilities:
Accounts payable and accrued expenses ÏÏÏÏÏÏÏÏÏÏÏÏÏÏÏÏÏ $ 17,330 $ 185,371 $ 2,736 $ Ì $ 205,437 $ Ì $ 325 $ Ì $ 205,762 $ 1,001 $ Ì $ 206,763
AMERCO's notes and loans payableÏÏÏÏÏÏÏÏÏÏÏÏÏÏÏÏÏÏÏÏ 780,008 Ì Ì Ì 780,008 Ì Ì Ì 780,008 Ì Ì 780,008
SAC Holding II Corporation notes and loans payable, non-
recourse to AMERCOÏÏÏÏÏÏÏÏÏÏÏÏÏÏÏÏÏÏÏÏÏÏÏÏÏÏÏÏÏÏ Ì Ì Ì Ì Ì Ì Ì Ì Ì 77,474 Ì 77,474
Policy benefits and losses, claims and loss expenses payable Ì 249,053 Ì Ì 249,053 391,383 164,685 Ì 805,121 Ì Ì 805,121
Liabilities from investment contracts ÏÏÏÏÏÏÏÏÏÏÏÏÏÏÏÏÏÏÏÏ Ì Ì Ì Ì Ì Ì 503,838 Ì 503,838 Ì Ì 503,838
Other policyholders' funds and liabilitiesÏÏÏÏÏÏÏÏÏÏÏÏÏÏÏÏÏ Ì Ì Ì Ì Ì 8,669 20,973 Ì 29,642 Ì Ì 29,642
Deferred incomeÏÏÏÏÏÏÏÏÏÏÏÏÏÏÏÏÏÏÏÏÏÏÏÏÏÏÏÏÏÏÏÏÏÏÏÏÏ Ì 11,716 2 Ì 11,718 12,143 14,279 Ì 38,140 603 Ì 38,743
Deferred income taxes ÏÏÏÏÏÏÏÏÏÏÏÏÏÏÏÏÏÏÏÏÏÏÏÏÏÏÏÏÏÏÏÏ 158,415 Ì Ì Ì 158,415 (46,948) (1,121) Ì 110,346 (4,973) (27,249)(d) 78,124
Related party liabilities ÏÏÏÏÏÏÏÏÏÏÏÏÏÏÏÏÏÏÏÏÏÏÏÏÏÏÏÏÏÏÏ 115,499 355,997 249,692 (650,371)(c) 70,817 8,910 12,315 (92,042)(c) Ì 92,947 (81,877)(c) 11,070
Total liabilities ÏÏÏÏÏÏÏÏÏÏÏÏÏÏÏÏÏÏÏÏÏÏÏÏÏÏÏÏÏÏÏÏÏÏÏÏÏÏÏÏ 1,071,252 802,137 252,430 (650,371) 1,475,448 374,157 715,294 (92,042) 2,472,857 167,052 (109,126) 2,530,783
Stockholders' equity:
Series preferred stock:
Series A preferred stock ÏÏÏÏÏÏÏÏÏÏÏÏÏÏÏÏÏÏÏÏÏÏÏÏÏÏÏÏ Ì Ì Ì Ì Ì Ì Ì Ì Ì Ì Ì Ì
Series B preferred stockÏÏÏÏÏÏÏÏÏÏÏÏÏÏÏÏÏÏÏÏÏÏÏÏÏÏÏÏÏ Ì Ì Ì Ì Ì Ì Ì Ì Ì Ì Ì Ì
Series A common stockÏÏÏÏÏÏÏÏÏÏÏÏÏÏÏÏÏÏÏÏÏÏÏÏÏÏÏÏÏÏÏ 929 Ì Ì Ì 929 Ì Ì Ì 929 Ì Ì 929
Common StockÏÏÏÏÏÏÏÏÏÏÏÏÏÏÏÏÏÏÏÏÏÏÏÏÏÏÏÏÏÏÏÏÏÏÏÏÏÏ 9,568 540 1 (541)(b) 9,568 3,300 2,500 (5,800)(b) 9,568 Ì Ì 9,568
Additional paid in-capital ÏÏÏÏÏÏÏÏÏÏÏÏÏÏÏÏÏÏÏÏÏÏÏÏÏÏÏÏÏ 396,415 121,230 147,481 (268,711)(b) 396,415 69,922 16,435 (86,357)(b) 396,415 Ì (46,071)(d) 350,344
Accumulated other comprehensive income/(loss)ÏÏÏÏÏÏÏÏÏ (30,661) (33,344) Ì 33,344 (b) (30,661) 2,582 54 (2,636)(b) (30,661) Ì Ì (30,661)
Retained earningsÏÏÏÏÏÏÏÏÏÏÏÏÏÏÏÏÏÏÏÏÏÏÏÏÏÏÏÏÏÏÏÏÏÏÏÏÏÏ 663,483 623,663 106,678 (730,341)(b) 663,483 79,032 96,008 (175,040)(b) 663,483 (14,659) 22,818(b, d) 671,642
Cost of common shares in treasury, net ÏÏÏÏÏÏÏÏÏÏÏÏÏÏÏÏÏÏÏ (418,092) Ì Ì Ì (418,092) Ì Ì Ì (418,092) Ì Ì (418,092)
Unearned employee stock ownership plan shares ÏÏÏÏÏÏÏÏÏÏÏÏ Ì (10,891) Ì Ì (10,891) Ì Ì Ì (10,891) Ì Ì (10,891)
Total stockholders' equity ÏÏÏÏÏÏÏÏÏÏÏÏÏÏÏÏÏÏÏÏÏÏÏÏÏÏÏÏÏÏÏ 621,642 701,198 254,160 (966,249) 610,751 154,836 114,997 (269,833) 610,751 (14,659) (23,253) 572,839
Total liabilities and stockholders' equity ÏÏÏÏÏÏÏÏÏÏÏÏÏÏÏÏÏÏÏ $1,692,894 $1,503,335 $506,590 $(1,616,620) $2,086,199 $528,993 $830,291 $(361,875) $3,083,608 $152,393 $(132,379) $3,103,622
(a) Balances as of December 31, 2004
(b) Eliminate investment in subsidiaries and SAC Holding II
(c) Eliminate intercompany receivables and payables
(d) Eliminate gain on sale of property from U-Haul to SAC Holding II
(e) Represents the Obligated Group