U-Haul 2005 Annual Report Download - page 43
Download and view the complete annual report
Please find page 43 of the 2005 U-Haul annual report below. You can navigate through the pages in the report by either clicking on the pages listed below, or by using the keyword search tool below to find specific information within the annual report.-
 1
1 -
2
-
3
-
4
-
5
-
6
-
7
-
8
-
9
-
10
-
11
-
12
-
13
-
14
-
15
-
16
-
17
-
18
-
19
-
20
-
21
-
22
-
23
-
24
-
25
-
26
-
27
-
28
-
29
-
30
-
31
-
32
-
 33
33 -
 34
34 -
 35
35 -
 36
36 -
 37
37 -
 38
38 -
 39
39 -
 40
40 -
 41
41 -
 42
42 -
 43
43 -
 44
44 -
 45
45 -
 46
46 -
 47
47 -
 48
48 -
 49
49 -
 50
50 -
 51
51 -
 52
52 -
 53
53 -
54
-
55
-
56
-
57
-
58
-
59
-
60
-
61
-
62
-
63
-
64
-
65
-
66
-
67
-
68
-
69
-
70
-
71
-
72
-
73
-
74
-
75
-
76
-
77
-
78
-
79
-
80
-
81
-
82
-
83
-
84
-
85
-
86
-
87
-
88
-
89
-
90
-
91
-
92
-
93
-
94
-
95
-
96
-
97
-
98
-
99
-
100
-
101
-
102
-
103
 |
 |

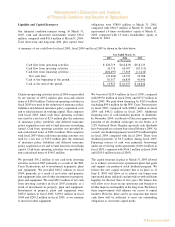
42 I AMERCO ANNUAL REPORT
as representations or warranties by the Company that
such matters will be realized. The Company disclaims
any intent or obligation to update or revise any of the
forward-lookingstatements,whetherinresponsetonew
information, unforeseen events, changed circumstances
orotherwise.
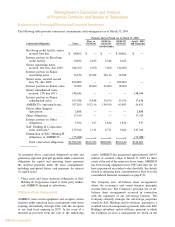
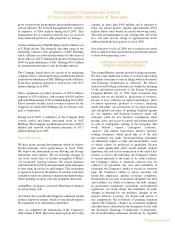
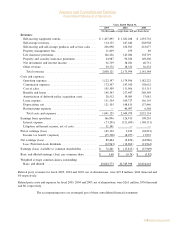
Quarterly Results (unaudited)
The quarterly results shown below are derived from
unaudited financial statements for the eight quarters
beginning April 1, 2003 and ending March 31, 2005.
The Company believes that all necessary adjustments
have been included in the amounts stated below to
presentfairly,andinaccordancewithgenerallyaccepted
accountingprinciples,suchresults.MovingandStorage
operations are seasonal and proportionally more of the
Company’srevenuesandnetearningsfromitsMovingand
Storageoperationsaregeneratedinthefirstandsecond
quarters of each fiscal year (April through September).
The operating results for the periods presented are not
necessarilyindicativeofresultsforanyfutureperiod.
as well as assumptions relating to the foregoing. The words ""believe'', ""expect'', ""anticipate'', ""estimate'',
""project'' and similar expressions identify forward-looking statements, which speak only as of the date the
statement was made. Forward-looking statements are inherently subject to risks and uncertainties, some of
which cannot be predicted or quantified. Factors that could significantly affect results include, without
limitation, the risk factors enumerated at the end of this section, as well as the following: the Company's
ability to operate pursuant to the terms of its credit facilities; the Company's ability to maintain contracts that
are critical to its operations; the costs and availability of financing; the Company's ability to execute its
business plan; the Company's ability to attract, motivate and retain key employees; general economic
conditions; fluctuations in our costs to maintain and update our fleet and facilities; our ability to refinance our
debt; changes in government regulations, particularly environmental regulations; our credit ratings; the
availability of credit; changes in demand for our products; changes in the general domestic economy; the
degree and nature of our competition; the resolution of pending litigation against the Company; changes in
accounting standards and other factors described in this report or the other documents we file with the
Securities Exchange Commission. These factors, as well as the factors disclosed below under the heading
""Risk Factors'', could contribute to or cause such differences, or could cause our stock price to fluctuate
dramatically. Consequently, the forward-looking statements should not be regarded as representations or
warranties by the Company that such matters will be realized. The Company disclaims any intent or obligation
to update or revise any of the forward-looking statements, whether in response to new information, unforeseen
events, changed circumstances or otherwise.
Quarterly Results (unaudited)
The quarterly results shown below are derived from unaudited financial statements for the eight quarters
beginning April 1, 2003 and ending March 31, 2005. The Company believes that all necessary adjustments
have been included in the amounts stated below to present fairly, and in accordance with generally accepted
accounting principles, such results. Moving and Storage operations are seasonal and proportionally more of the
Company's revenues and net earnings from its Moving and Storage operations are generated in the first and
second quarters of each fiscal year (April through September). The operating results for the periods presented
are not necessarily indicative of results for any future period.
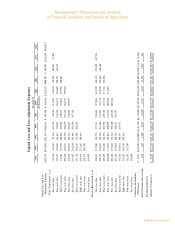
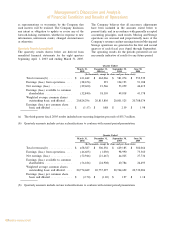
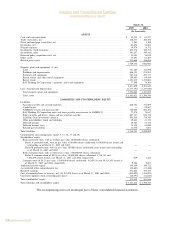
Quarter Ended
March 31, December 31, September 30, June 30,
2005 2004(a) 2004 2004
(In thousands, except for share and per share data)
Total revenues(b) ÏÏÏÏÏÏÏÏÏÏÏÏÏÏÏÏ $ 411,442 $ 462,066 $ 581,074 $ 553,539
Earnings (loss) from operationsÏÏÏÏÏ (28,676) 291 104,193 91,188
Net earnings (loss) ÏÏÏÏÏÏÏÏÏÏÏÏÏÏÏ (29,600) 21,546 53,059 44,419
Earnings (loss) available to common
shareholders ÏÏÏÏÏÏÏÏÏÏÏÏÏÏÏÏÏÏÏ (32,840) 18,305 49,818 41,178
Weighted average common shares
outstanding basic and diluted ÏÏÏÏÏ 20,824,296 20,813,805 20,801,525 20,788,074
Earnings (loss) per common share
basic and diluted ÏÏÏÏÏÏÏÏÏÏÏÏÏÏÏ $ (1.57) $ 0.88 $ 2.39 $ 1.98
(a) The third quarter fiscal 2005 results included non-recurring litigation proceeds of $51.3 million.
(b) Quarterly amounts include certain reclassifications to conform with current period presentation.
35
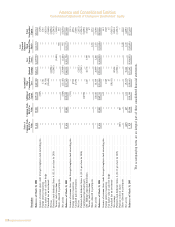
Quarter Ended
March 31, December 31, September 30, June 30,
2004 2003 2003 2003
(In thousands, except for share and per share data)
Total revenues(b) ÏÏÏÏÏÏÏÏÏÏÏÏÏÏÏÏ $ 458,387 $ 506,356 $ 629,185 $ 582,066
Earnings (loss) from operationsÏÏÏÏÏ (46,605) (1,030) 98,990 75,560
Net earnings (loss) ÏÏÏÏÏÏÏÏÏÏÏÏÏÏÏ (52,946) (21,667) 44,025 27,736
Earnings (loss) available to common
shareholders ÏÏÏÏÏÏÏÏÏÏÏÏÏÏÏÏÏÏÏ (56,186) (24,908) 40,784 24,495
Weighted average common shares
outstanding basic and diluted ÏÏÏÏÏ 20,774,689 20,757,297 20,744,692 20,732,086
Earnings (loss) per common share
basic and diluted ÏÏÏÏÏÏÏÏÏÏÏÏÏÏÏ $ (2.70) $ (1.20) $ 1.97 $ 1.18
(b) Quarterly amounts include certain reclassifications to conform with current period presentation.
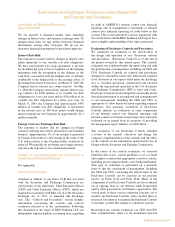
Risk Factors
We operate in a highly competitive industry.
The truck rental industry is highly competitive and includes a number of significant national, regional and
local competitors. Competition is generally based on convenience of rental locations, availability of quality
rental moving equipment, breadth of essential services and price. In our truck rental business, we face
competition from Budget Car and Truck Rental Company and Penske Truck Leasing. Some of our
competitors may have greater financial resources than we have. We cannot assure you that we will not be
forced to reduce our rental prices or delay price increases.
The self-storage industry is large and highly fragmented. We believe the principle competitive factors in
this industry are convenience of storage rental locations, cleanliness, security and price. Our primary
competitors in the self-storage market are Public Storage, Shurgard, Storage USA and others. Competition in
the market areas in which we operate is significant and affects the occupancy levels, rental sales and operating
expenses of our facilities. Competition might cause us to experience a decrease in occupancy levels, limit our
ability to raise rental sales and require us to offer discounted rates that would have a material affect on
operating results.
Entry into the self-storage business through acquisition of existing facilities is possible for persons or
institutions with the required initial capital. Development of new self-storage facilities is more difficult,
however, due to zoning, environmental and other regulatory requirements. The self-storage industry has in the
past experienced overbuilding in response to perceived increases in demand. We cannot assure you that we will
be able to successfully compete in existing markets or expand into new markets.
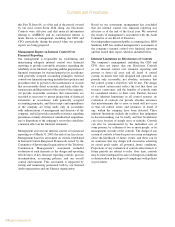
Control of AMERCO remains in the hands of a small contingent.
As of March 31, 2005, Edward J. Shoen, Chairman of the Board of Directors and President of
AMERCO, James P. Shoen, a director of AMERCO, and Mark V. Shoen, an executive officer of AMERCO,
collectively are beneficial owners of 8,810,077 shares (approximately 41.39%) of the outstanding common
shares of AMERCO. Accordingly, Edward J. Shoen, Mark V. Shoen and James P. Shoen will be in a position
to continue to influence the election of the members of the Board of Directors and approval of significant
transactions. In addition, 2,166,799 shares (approximately 10.18%) of the outstanding common shares of
AMERCO, including shares allocated to employees and unallocated shares, are held by our Employee Savings
and Employee Stock Ownership Trust.
36
(a) Thethirdquarterfiscal2005resultsincludednon-recurringlitigationproceedsof$51.3million.
(b) Quarterlyamountsincludecertainreclassificationstoconformwithcurrentperiodpresentation.
(b) Quarterlyamountsincludecertainreclassificationstoconformwithcurrentperiodpresentation.
Management’s Discussion and Analysis
of Financial Condition and Results of Operations