U-Haul 2005 Annual Report Download - page 81
Download and view the complete annual report
Please find page 81 of the 2005 U-Haul annual report below. You can navigate through the pages in the report by either clicking on the pages listed below, or by using the keyword search tool below to find specific information within the annual report.-
 1
1 -
2
-
3
-
4
-
5
-
6
-
7
-
8
-
9
-
10
-
11
-
12
-
13
-
14
-
15
-
16
-
17
-
18
-
19
-
20
-
21
-
22
-
23
-
24
-
25
-
26
-
27
-
28
-
29
-
30
-
31
-
32
-
33
-
34
-
35
-
36
-
37
-
38
-
39
-
40
-
41
-
42
-
43
-
44
-
45
-
46
-
47
-
48
-
49
-
50
-
51
-
52
-
53
-
54
-
55
-
56
-
57
-
58
-
59
-
60
-
61
-
62
-
63
-
64
-
65
-
66
-
67
-
68
-
69
-
70
-
 71
71 -
 72
72 -
 73
73 -
 74
74 -
 75
75 -
 76
76 -
 77
77 -
 78
78 -
 79
79 -
 80
80 -
 81
81 -
 82
82 -
 83
83 -
 84
84 -
 85
85 -
 86
86 -
 87
87 -
 88
88 -
 89
89 -
 90
90 -
 91
91 -
92
-
93
-
94
-
95
-
96
-
97
-
98
-
99
-
100
-
101
-
102
-
103
 |
 |

80 I AMERCO ANNUAL REPORT
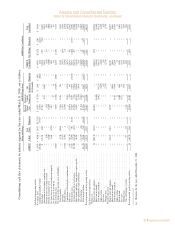
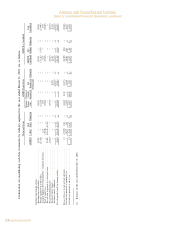
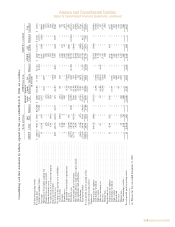
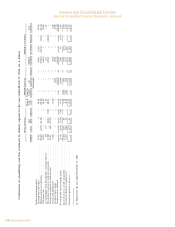
Amerco and Consolidated Entities
Notes to Consolidated Financial Statements, continued
F-39
AMERCO AND CONSOLIDATED ENTITIES
NOTES TO CONSOLIDATED FINANCIAL STATEMENTS Ì (Continued)
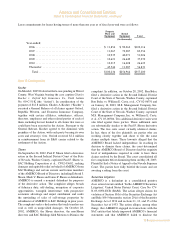
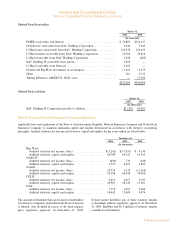
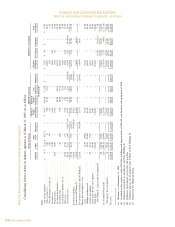
Note 21A: Financial Information by Consolidating Industry Segment:
Consolidating balance sheets by industry segment as of March 31, 2005 are as follows:
Moving and Storage AMERCO Legal Group AMERCO as Consolidated
Moving & Property &
Real Storage Casualty Life AMERCO Total
AMERCO U-Haul Estate Eliminations Consolidated(f) Insurance(a) Insurance(a) Eliminations Consolidated SAC Holdings Eliminations Consolidated
(In thousands)
Assets:
Cash and cash equivalents ÏÏÏÏÏÏÏÏÏÏÏÏÏÏÏÏÏÏÏÏÏÏÏÏÏÏ $ 14 $ 37,626 $ 4,327 $ Ì $ 41,967 $ 10,638 $ 2,992 $ Ì $ 55,597 $ 358 $ Ì $ 55,955
Trade receivables, net ÏÏÏÏÏÏÏÏÏÏÏÏÏÏÏÏÏÏÏÏÏÏÏÏÏÏÏÏÏÏ Ì 9,294 26 Ì 9,320 211,821 15,676 Ì 236,817 Ì Ì 236,817
Notes and mortgage receivables, net ÏÏÏÏÏÏÏÏÏÏÏÏÏÏÏÏÏÏ Ì 1,020 945 Ì 1,965 Ì Ì Ì 1,965 Ì Ì 1,965
Inventories, net ÏÏÏÏÏÏÏÏÏÏÏÏÏÏÏÏÏÏÏÏÏÏÏÏÏÏÏÏÏÏÏÏÏÏÏ Ì 62,489 Ì Ì 62,489 Ì Ì Ì 62,489 1,169 Ì 63,658
Prepaid expenses ÏÏÏÏÏÏÏÏÏÏÏÏÏÏÏÏÏÏÏÏÏÏÏÏÏÏÏÏÏÏÏÏÏÏ 4,863 14,865 Ì Ì 19,728 Ì Ì Ì 19,728 146 Ì 19,874
Investments, fixed maturities ÏÏÏÏÏÏÏÏÏÏÏÏÏÏÏÏÏÏÏÏÏÏÏÏ Ì Ì Ì Ì Ì 100,028 535,150 Ì 635,178 Ì Ì 635,178
Investments, other ÏÏÏÏÏÏÏÏÏÏÏÏÏÏÏÏÏÏÏÏÏÏÏÏÏÏÏÏÏÏÏÏÏ Ì 936 8,056 Ì 8,992 144,839 191,376 Ì 345,207 Ì Ì 345,207
Deferred policy acquisition costs, net ÏÏÏÏÏÏÏÏÏÏÏÏÏÏÏÏÏ Ì Ì Ì Ì Ì 1,273 51,270 Ì 52,543 Ì Ì 52,543
Other assets ÏÏÏÏÏÏÏÏÏÏÏÏÏÏÏÏÏÏÏÏÏÏÏÏÏÏÏÏÏÏÏÏÏÏÏÏÏÏ 14,207 59,582 1,737 Ì 75,526 3,915 1,611 Ì 81,052 4,239 Ì 85,291
Related party assetsÏÏÏÏÏÏÏÏÏÏÏÏÏÏÏÏÏÏÏÏÏÏÏÏÏÏÏÏÏÏÏÏ 452,350 521,162 12,600 (650,371)(d) 335,741 56,479 32,216 (92,042)(d) 332,394 2,202 (81,930)(d) 252,666
471,434 706,974 27,691 (650,371) 555,728 528,993 830,291 (92,042) 1,822,970 8,114 (81,930) 1,749,154
Investment in subsidiariesÏÏÏÏÏÏÏÏÏÏÏÏÏÏÏÏÏÏÏÏÏÏÏÏÏÏÏÏÏ 1,236,082 Ì Ì (966,249)(c) 269,833 Ì Ì (269,833)(c) Ì Ì Ì Ì
Investment in SAC Holding II ÏÏÏÏÏÏÏÏÏÏÏÏÏÏÏÏÏÏÏÏÏÏÏÏ (14,659) Ì Ì Ì (14,659) Ì Ì Ì (14,659) Ì 14,659(c) Ì
Total investment in subsidiaries and SAC Holding II ÏÏÏÏÏ 1,221,423 Ì Ì (966,249) 255,174 Ì Ì (269,833) (14,659) Ì 14,659 Ì
Property, plant and equipment, at cost:
Land ÏÏÏÏÏÏÏÏÏÏÏÏÏÏÏÏÏÏÏÏÏÏÏÏÏÏÏÏÏÏÏÏÏÏÏÏÏÏÏÏÏÏÏÏ Ì 21,265 129,880 Ì 151,145 Ì Ì Ì 151,145 Ì Ì 151,145
Buildings and improvementsÏÏÏÏÏÏÏÏÏÏÏÏÏÏÏÏÏÏÏÏÏÏÏÏÏ Ì 84,921 601,304 Ì 686,225 Ì Ì Ì 686,225 Ì Ì 686,225
Furniture and equipment ÏÏÏÏÏÏÏÏÏÏÏÏÏÏÏÏÏÏÏÏÏÏÏÏÏÏÏ 292 247,219 17,705 Ì 265,216 Ì Ì Ì 265,216 Ì Ì 265,216
Rental trailers and other rental equipment ÏÏÏÏÏÏÏÏÏÏÏÏÏ Ì 199,461 Ì Ì 199,461 Ì Ì Ì 199,461 Ì Ì 199,461
Rental trucks ÏÏÏÏÏÏÏÏÏÏÏÏÏÏÏÏÏÏÏÏÏÏÏÏÏÏÏÏÏÏÏÏÏÏÏÏÏ Ì 1,252,018 Ì Ì 1,252,018 Ì Ì Ì 1,252,018 Ì Ì 1,252,018
SAC Holding II Ì property, plant and equipment(b) Ì Ì Ì Ì Ì Ì Ì Ì Ì 151,806 (74,212)(e) 77,594
292 1,804,884 748,889 Ì 2,554,065 Ì Ì Ì 2,554,065 151,806 (74,212) 2,631,659
Less: Accumulated depreciation ÏÏÏÏÏÏÏÏÏÏÏÏÏÏÏÏÏÏÏÏÏÏÏ (255) (1,008,523) (269,990) Ì (1,278,768) Ì Ì Ì (1,278,768) (7,527) 9,104(e) (1,277,191)
Total property, plant and equipment ÏÏÏÏÏÏÏÏÏÏÏÏÏÏÏÏÏÏ 37 796,361 478,899 Ì 1,275,297 Ì Ì Ì 1,275,297 144,279 (65,108) 1,354,468
Total assetsÏÏÏÏÏÏÏÏÏÏÏÏÏÏÏÏÏÏÏÏÏÏÏÏÏÏÏÏÏÏÏÏÏÏÏÏÏÏÏÏÏ $1,692,894 $ 1,503,335 $ 506,590 $ (1,616,620) $ 2,086,199 $528,993 $830,291 $(361,875) $ 3,083,608 $152,393 $(132,379) $ 3,103,622
(a) Balances as of December 31, 2004
(b) Included in this caption is land of $56,960, buildings and improvements of $94,620, and furniture and equipment of $226
(c) Eliminate investment in subsidiaries and SAC Holding II
(d) Eliminate intercompany receivables and payables
(e) Eliminate gain on sale of property from U-Haul to SAC Holding II
(f) Represents the Obligated Group
Note 21A: Financial Information by Consolidating Industry Segment: