U-Haul 2005 Annual Report Download - page 84
Download and view the complete annual report
Please find page 84 of the 2005 U-Haul annual report below. You can navigate through the pages in the report by either clicking on the pages listed below, or by using the keyword search tool below to find specific information within the annual report.-
 1
1 -
2
-
3
-
4
-
5
-
6
-
7
-
8
-
9
-
10
-
11
-
12
-
13
-
14
-
15
-
16
-
17
-
18
-
19
-
20
-
21
-
22
-
23
-
24
-
25
-
26
-
27
-
28
-
29
-
30
-
31
-
32
-
33
-
34
-
35
-
36
-
37
-
38
-
39
-
40
-
41
-
42
-
43
-
44
-
45
-
46
-
47
-
48
-
49
-
50
-
51
-
52
-
53
-
54
-
55
-
56
-
57
-
58
-
59
-
60
-
61
-
62
-
63
-
64
-
65
-
66
-
67
-
68
-
69
-
70
-
71
-
72
-
73
-
 74
74 -
 75
75 -
 76
76 -
 77
77 -
 78
78 -
 79
79 -
 80
80 -
 81
81 -
 82
82 -
 83
83 -
 84
84 -
 85
85 -
 86
86 -
 87
87 -
 88
88 -
 89
89 -
 90
90 -
 91
91 -
 92
92 -
 93
93 -
 94
94 -
95
-
96
-
97
-
98
-
99
-
100
-
101
-
102
-
103
 |
 |

83 I AMERCO ANNUAL REPORT
Amerco and Consolidated Entities
Notes to Consolidated Financial Statements, continued
F-42
AMERCO AND CONSOLIDATED ENTITIES
NOTES TO CONSOLIDATED FINANCIAL STATEMENTS Ì (Continued)
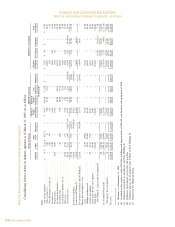
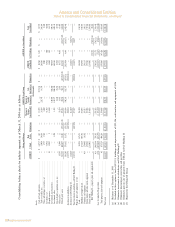
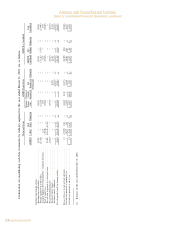
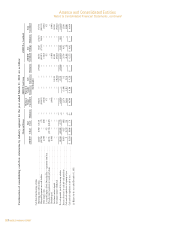
Consolidating balance sheets by industry segment as of March 31, 2004 are as follows:
Moving and Storage AMERCO Legal Group AMERCO as Consolidated
Moving & Property &
Real Storage Casualty Life AMERCO Total
AMERCO U-Haul Estate Eliminations Consolidated(e) Insurance(a) Insurance(a) Eliminations Consolidated SAC Holdings Eliminations Consolidated
(In thousands)
Liabilities:
Accounts payable and accrued expenses ÏÏÏÏÏÏÏÏÏÏÏÏÏÏÏÏÏ $ 96,930 $ 212,627 $ 365 $ Ì $ 309,922 734 $ Ì $ Ì $ 310,656 $ 1,333 $ Ì $ 311,989
Capital leasesÏÏÏÏÏÏÏÏÏÏÏÏÏÏÏÏÏÏÏÏÏÏÏÏÏÏÏÏÏÏÏÏÏÏÏÏÏÏÏÏ Ì 99,607 Ì Ì 99,607 Ì Ì Ì 99,607 Ì Ì 99,607
AMERCO's notes and loans payable ÏÏÏÏÏÏÏÏÏÏÏÏÏÏÏÏÏÏÏÏ 862,700 Ì 3 Ì 862,703 Ì Ì Ì 862,703 Ì Ì 862,703
SAC Holding II Corporation notes and loans payable, non-
recourse to AMERCO ÏÏÏÏÏÏÏÏÏÏÏÏÏÏÏÏÏÏÏÏÏÏÏÏÏÏÏÏÏÏ Ì Ì Ì Ì Ì Ì Ì Ì Ì 78,637 Ì 78,637
Policy benefits and losses, claims and loss expenses payable Ì 206,595 Ì Ì 206,595 436,593 177,550 Ì 820,738 Ì Ì 820,738
Liabilities from investment contracts ÏÏÏÏÏÏÏÏÏÏÏÏÏÏÏÏÏÏÏÏ Ì Ì Ì Ì Ì Ì 574,745 Ì 574,745 Ì Ì 574,745
Other policyholders' funds and liabilities ÏÏÏÏÏÏÏÏÏÏÏÏÏÏÏÏÏ Ì Ì Ì Ì Ì 11,369 10,363 Ì 21,732 Ì Ì 21,732
Deferred income ÏÏÏÏÏÏÏÏÏÏÏÏÏÏÏÏÏÏÏÏÏÏÏÏÏÏÏÏÏÏÏÏÏÏÏÏÏ Ì 23,045 36 Ì 23,081 15,229 14,279 Ì 52,589 561 Ì 53,150
Deferred income taxes ÏÏÏÏÏÏÏÏÏÏÏÏÏÏÏÏÏÏÏÏÏÏÏÏÏÏÏÏÏÏÏÏ 125,355 Ì Ì Ì 125,355 (43,207) 12,528 Ì 94,676 (3,468) (27,408)(d) 63,800
Related party liabilitiesÏÏÏÏÏÏÏÏÏÏÏÏÏÏÏÏÏÏÏÏÏÏÏÏÏÏÏÏÏÏÏÏ 22,300 308,973 291,719 (535,121)(c) 87,871 8,533 11,248 (107,652)(c) Ì 89,458 (85,657)(c) 3,801
Total liabilitiesÏÏÏÏÏÏÏÏÏÏÏÏÏÏÏÏÏÏÏÏÏÏÏÏÏÏÏÏÏÏÏÏÏÏÏÏÏÏÏÏÏ 1,107,285 850,847 292,123 (535,121) 1,715,134 429,251 800,713 (107,652) 2,837,446 166,521 (113,065) 2,890,902
Stockholders' equity:
Series preferred stock:
Series A preferred stockÏÏÏÏÏÏÏÏÏÏÏÏÏÏÏÏÏÏÏÏÏÏÏÏÏÏÏÏÏ Ì Ì Ì Ì Ì Ì Ì Ì Ì Ì Ì Ì
Series B preferred stock ÏÏÏÏÏÏÏÏÏÏÏÏÏÏÏÏÏÏÏÏÏÏÏÏÏÏÏÏÏ Ì Ì Ì Ì Ì Ì Ì Ì Ì Ì Ì Ì
Serial A common stock ÏÏÏÏÏÏÏÏÏÏÏÏÏÏÏÏÏÏÏÏÏÏÏÏÏÏÏÏÏÏÏ 1,416 Ì Ì Ì 1,416 Ì Ì Ì 1,416 Ì Ì 1,416
Common Stock ÏÏÏÏÏÏÏÏÏÏÏÏÏÏÏÏÏÏÏÏÏÏÏÏÏÏÏÏÏÏÏÏÏÏÏÏÏÏ 9,081 540 1 (541)(b) 9,081 3,300 2,500 (5,800)(b) 9,081 Ì Ì 9,081
Additional paid in-capitalÏÏÏÏÏÏÏÏÏÏÏÏÏÏÏÏÏÏÏÏÏÏÏÏÏÏÏÏÏÏ 395,803 121,230 147,481 (268,711)(b) 395,803 70,023 16,435 (86,458)(b) 395,803 Ì (46,071)(d) 349,732
Accumulated other comprehensive income/(loss) ÏÏÏÏÏÏÏÏÏ (21,446) (34,913) Ì 34,913 (b) (21,446) 6,975 7,299 (14,274)(b) (21,446) Ì Ì (21,446)
Retained earnings ÏÏÏÏÏÏÏÏÏÏÏÏÏÏÏÏÏÏÏÏÏÏÏÏÏÏÏÏÏÏÏÏÏÏÏÏÏÏ 587,370 526,683 86,523 (613,206)(b) 587,370 88,742 94,760 (183,502)(b) 587,370 (12,427) 20,238(b, d) 595,181
Cost of common shares in treasury, net ÏÏÏÏÏÏÏÏÏÏÏÏÏÏÏÏÏÏÏÏ (418,092) Ì Ì Ì (418,092) Ì Ì Ì (418,092) Ì Ì (418,092)
Unearned employee stock ownership plan shares ÏÏÏÏÏÏÏÏÏÏÏÏ Ì (12,026) Ì Ì (12,026) Ì Ì Ì (12,026) Ì Ì (12,026)
Total stockholders' equity ÏÏÏÏÏÏÏÏÏÏÏÏÏÏÏÏÏÏÏÏÏÏÏÏÏÏÏÏÏÏÏ 554,132 601,514 234,005 (847,545) 542,106 169,040 120,994 (290,034) 542,106 (12,427) (25,833) 503,846
Total liabilities and stockholders' equity ÏÏÏÏÏÏÏÏÏÏÏÏÏÏÏÏÏÏÏ $1,661,417 $1,452,361 $526,128 $(1,382,666) $2,257,240 $598,291 $921,707 $(397,686) $3,379,552 $154,094 $(138,898) $3,394,748
(a) Balances as of December 31, 2003
(b) Eliminate investment in subsidiaries and SAC Holding II
(c) Eliminated intercompany receivables and payables
(d) Eliminate gain on sale of property from U-Haul to SAC Holding II
(e) Represents the Obligated Group