U-Haul 2005 Annual Report Download - page 89
Download and view the complete annual report
Please find page 89 of the 2005 U-Haul annual report below. You can navigate through the pages in the report by either clicking on the pages listed below, or by using the keyword search tool below to find specific information within the annual report.-
 1
1 -
2
-
3
-
4
-
5
-
6
-
7
-
8
-
9
-
10
-
11
-
12
-
13
-
14
-
15
-
16
-
17
-
18
-
19
-
20
-
21
-
22
-
23
-
24
-
25
-
26
-
27
-
28
-
29
-
30
-
31
-
32
-
33
-
34
-
35
-
36
-
37
-
38
-
39
-
40
-
41
-
42
-
43
-
44
-
45
-
46
-
47
-
48
-
49
-
50
-
51
-
52
-
53
-
54
-
55
-
56
-
57
-
58
-
59
-
60
-
61
-
62
-
63
-
64
-
65
-
66
-
67
-
68
-
69
-
70
-
71
-
72
-
73
-
74
-
75
-
76
-
77
-
78
-
 79
79 -
 80
80 -
 81
81 -
 82
82 -
 83
83 -
 84
84 -
 85
85 -
 86
86 -
 87
87 -
 88
88 -
 89
89 -
 90
90 -
 91
91 -
 92
92 -
 93
93 -
 94
94 -
 95
95 -
 96
96 -
 97
97 -
 98
98 -
 99
99 -
100
-
101
-
102
-
103
 |
 |

88 I AMERCO ANNUAL REPORT
Amerco and Consolidated Entities
Notes to Consolidated Financial Statements, continued
F-47
AMERCO AND CONSOLIDATED ENTITIES
NOTES TO CONSOLIDATED FINANCIAL STATEMENTS Ì (Continued)
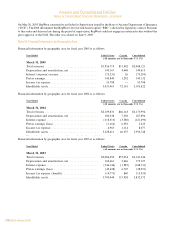
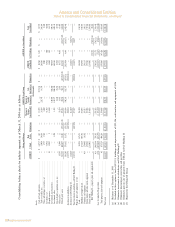
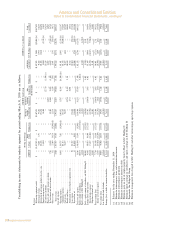
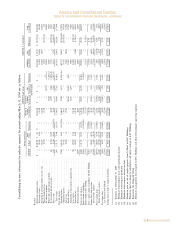
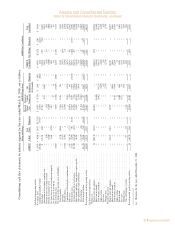
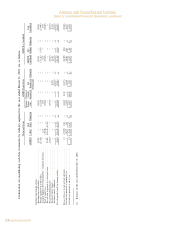
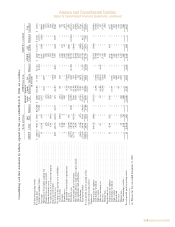
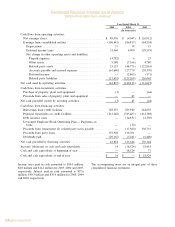
Continuation of consolidating cash flow statements by industry segment for the year ended March 31, 2005, are as follows:
Moving and Storage AMERCO Legal Group AMERCO as Consolidated
Moving & Property &
Real Storage Casualty Life AMERCO SAC Total
AMERCO U-Haul Estate Elimination Cons Insurance(a) Insurance(a) Elimination Consolidated Holdings Elimination Consolidated
(In thousands)
Cash flows from financing activities:
Borrowings from credit facilities ÏÏÏÏÏÏÏÏÏÏÏÏÏÏÏÏÏÏÏÏÏÏÏÏÏÏÏÏÏÏÏÏÏÏÏÏÏÏ 129,355 Ì Ì Ì 129,355 Ì Ì Ì 129,355 Ì Ì 129,355
Principal repayments on credit facilitiesÏÏÏÏÏÏÏÏÏÏÏÏÏÏÏÏÏÏÏÏÏÏÏÏÏÏÏÏÏÏÏÏ (212,242) Ì Ì Ì (212,242) Ì Ì Ì (212,242) (1,163) Ì (213,405)
Leveraged Employee Stock Ownership Plan Ì repayments from loans ÏÏÏÏÏÏ Ì 1,135 Ì Ì 1,135 Ì Ì Ì 1,135 Ì Ì 1,135
Payoff of capital leasesÏÏÏÏÏÏÏÏÏÏÏÏÏÏÏÏÏÏÏÏÏÏÏÏÏÏÏÏÏÏÏÏÏÏÏÏÏÏÏÏÏÏÏÏÏÏ Ì (99,609) Ì Ì (99,609) Ì Ì Ì (99,609) Ì (99,609)
Proceeds from (repayment of) related party loans ÏÏÏÏÏÏÏÏÏÏÏÏÏÏÏÏÏÏÏÏÏÏÏ 155,908 (114,635) (41,273) Ì Ì Ì Ì Ì Ì Ì Ì Ì
Preferred stock dividends paidÏÏÏÏÏÏÏÏÏÏÏÏÏÏÏÏÏÏÏÏÏÏÏÏÏÏÏÏÏÏÏÏÏÏÏÏÏÏÏÏ (29,167) Ì Ì Ì (29,167) Ì Ì Ì (29,167) Ì Ì (29,167)
Investment contract deposits ÏÏÏÏÏÏÏÏÏÏÏÏÏÏÏÏÏÏÏÏÏÏÏÏÏÏÏÏÏÏÏÏÏÏÏÏÏÏÏÏÏ Ì Ì Ì Ì Ì Ì 26,331 Ì 26,331 Ì Ì 26,331
Investment contract withdrawalsÏÏÏÏÏÏÏÏÏÏÏÏÏÏÏÏÏÏÏÏÏÏÏÏÏÏÏÏÏÏÏÏÏÏÏÏÏÏ Ì Ì Ì Ì Ì Ì (97,137) Ì (97,137) Ì Ì (97,137)
Net cash provided (used) by financing activities ÏÏÏÏÏÏÏÏÏÏÏÏÏÏÏÏÏÏÏÏÏÏÏÏÏÏ 43,854 (213,109) (41,273) Ì (210,528) Ì (70,806) Ì (281,334) (1,163) Ì (282,497)
Increase (decrease) in cash and cash equivalentsÏÏÏÏÏÏÏÏÏÏÏÏÏÏÏÏÏÏÏÏÏÏÏÏÏÏ 14 (27,091) 3,666 Ì (23,411) 10,638 (12,176) Ì (24,949) (653) Ì (25,602)
Cash and cash equivalents at beginning of year ÏÏÏÏÏÏÏÏÏÏÏÏÏÏÏÏÏÏÏÏÏÏÏÏÏÏÏ Ì 64,717 661 Ì 65,378 Ì 15,168 Ì 80,546 1,011 Ì 81,557
Cash and cash equivalents at end of year ÏÏÏÏÏÏÏÏÏÏÏÏÏÏÏÏÏÏÏÏÏÏÏÏÏÏÏÏÏÏÏÏ $ 14 $ 37,626 $ 4,327 $Ì $ 41,967 $10,638 $ 2,992 $Ì $ 55,597 $ 358 $Ì $ 55,955
(a) Balances for the year ended December 31, 2004