Tyson Foods 2010 Annual Report Download - page 71
Download and view the complete annual report
Please find page 71 of the 2010 Tyson Foods annual report below. You can navigate through the pages in the report by either clicking on the pages listed below, or by using the keyword search tool below to find specific information within the annual report.-
 1
1 -
2
-
3
-
4
-
5
-
6
-
7
-
8
-
9
-
10
-
11
-
12
-
13
-
14
-
15
-
16
-
17
-
18
-
19
-
20
-
21
-
22
-
23
-
24
-
25
-
26
-
27
-
28
-
29
-
30
-
31
-
32
-
33
-
34
-
35
-
36
-
37
-
38
-
39
-
40
-
41
-
42
-
43
-
44
-
45
-
46
-
47
-
48
-
49
-
50
-
51
-
52
-
53
-
54
-
55
-
56
-
57
-
58
-
59
-
60
-
 61
61 -
 62
62 -
 63
63 -
 64
64 -
 65
65 -
 66
66 -
 67
67 -
 68
68 -
 69
69 -
 70
70 -
 71
71 -
 72
72 -
 73
73 -
 74
74 -
 75
75 -
 76
76 -
 77
77 -
 78
78 -
 79
79 -
 80
80 -
 81
81 -
82
-
83
-
84
-
85
-
86
-
87
-
88
-
89
-
90
-
91
-
92
-
93
-
94
-
95
 |
 |

71
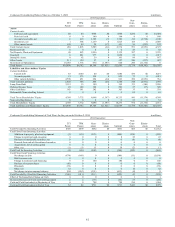
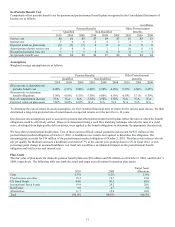
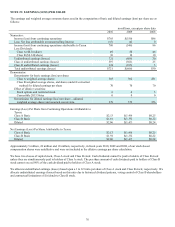
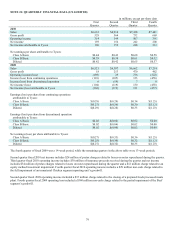
Net Periodic Benefit Cost
Components of net periodic benefit cost for pension and postretirement benefit plans recognized in the Consolidated Statements of
Income are as follows:
in millions
Pension Benefits Other Postretirement
Qualified Non-Qualified Benefits
2010 2009 2008 2010 2009 2008 2010 2009 2008
Service cost $0 $0 $0 $3 $4 $3 $1 $0 $1
Interest cost 5 6 6 2 2 2 2 3 3
Expected return on plan assets (6) (7) (7) 0 0 0 0 0 0
Amortization of prior service cost 0 0 0 1 1 1 (1) 0 (1)
Recognized actuarial loss, net 1 1 1 0 0 0 0 1 1
Net periodic benefit cost $0 $0 $0 $6 $7 $6 $2 $4 $4
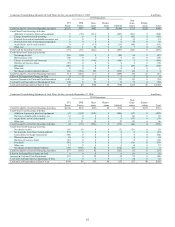
Assumptions
Weighted average assumptions are as follows:
Pension Benefits Other Postretirement
Qualified Non-Qualified Benefits
2010 2009 2008 2010 2009 2008 2010 2009 2008
Discount rate to determine net
periodic benefit cost 6.00% 6.33% 5.88% 6.00% 6.50% 6.25% 5.71% 6.50% 6.25%
Discount rate to determine
benefit obligations 5.06% 6.00% 6.33% 5.50% 6.00% 6.50% 4.50% 5.71% 6.50%
Rate of compensation increase N/A N/A N/A 3.50% 3.50% 3.50% N/A N/A N/A
Expected return on plan assets 7.80% 8.00% 8.02% N/A N/A N/A N/A N/A N/A
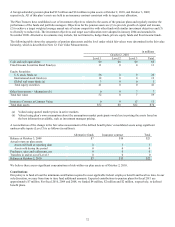
To determine the rate-of-return on assets assumption, we first examined historical rates of return for the various asset classes. We then
determined a long-term projected rate-of-return based on expected returns over the next five to 10 years.
Our discount rate assumptions used to account for pension and other postretirement benefit plans reflect the rates at which the benefit
obligations could be effectively settled. These were determined using a cash flow matching technique whereby the rates of a yield
curve, developed from high-quality debt securities, were applied to the benefit obligations to determine the appropriate discount rate.
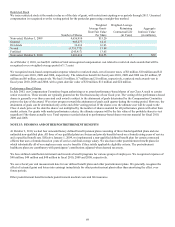
We have three postretirement health plans. Two of these consist of fixed, annual payments and account for $31 million of the
postretirement medical obligation at October 2, 2010. A healthcare cost trend is not required to determine this obligation. The
remaining plan accounts for $14 million of the postretirement medical obligation at October 2, 2010. The plan covers retirees who do
not yet qualify for Medicare and uses a healthcare cost trend of 7% in the current year, grading down to 6% in fiscal 2012. A one-
percentage point change in assumed healthcare cost trend rate would have an immaterial impact on the postretirement benefit
obligation and total service and interest cost.
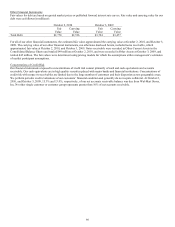
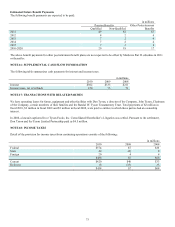
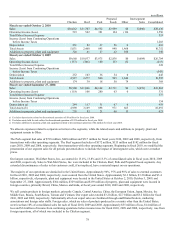
Plan Assets
The fair value of plan assets for domestic pension benefit plans was $59 million and $54 million as of October 2, 2010, and October 3,
2009, respectively. The following table sets forth the actual and target asset allocation for pension plan assets:
Target Asset
2010 2009 Allocation
Cash 0.3% 0.2% 1.0%
Fixed income securities 18.5 19.7 19.0
US Stock Funds 44.6 43.2 45.0
International Stock Funds 19.9 20.2 20.0
Real Estate 5.0 4.7 5.0
Alternatives 11.7 12.0 10.0
Total 100.0% 100.0% 100.0%