Tyson Foods 2010 Annual Report Download - page 26
Download and view the complete annual report
Please find page 26 of the 2010 Tyson Foods annual report below. You can navigate through the pages in the report by either clicking on the pages listed below, or by using the keyword search tool below to find specific information within the annual report.-
 1
1 -
2
-
3
-
4
-
5
-
6
-
7
-
8
-
9
-
10
-
11
-
12
-
13
-
14
-
15
-
 16
16 -
 17
17 -
 18
18 -
 19
19 -
 20
20 -
 21
21 -
 22
22 -
 23
23 -
 24
24 -
 25
25 -
 26
26 -
 27
27 -
 28
28 -
 29
29 -
 30
30 -
 31
31 -
 32
32 -
 33
33 -
 34
34 -
 35
35 -
 36
36 -
37
-
38
-
39
-
40
-
41
-
42
-
43
-
44
-
45
-
46
-
47
-
48
-
49
-
50
-
51
-
52
-
53
-
54
-
55
-
56
-
57
-
58
-
59
-
60
-
61
-
62
-
63
-
64
-
65
-
66
-
67
-
68
-
69
-
70
-
71
-
72
-
73
-
74
-
75
-
76
-
77
-
78
-
79
-
80
-
81
-
82
-
83
-
84
-
85
-
86
-
87
-
88
-
89
-
90
-
91
-
92
-
93
-
94
-
95
 |
 |

26
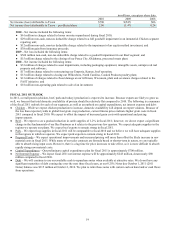
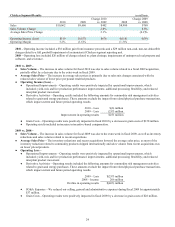
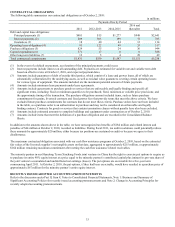
Pork Segment Results in millions
2010 2009
Change 2010
vs. 2009 2008
Change 2009
vs. 2008
Sales $4,552 $3,875 $677 $4,104 $(229)
Sales Volume Change (3.3)% 1.7%
Average Sales Price Change 21.4% (7.2)%
Operating Income $381 $160 $221 $280 $(120)
Operating Margin 8.4% 4.1% 6.8%
2008 – Operating income included $5 million of charges related to impairment of packaging equipment and severance.
2010 vs. 2009 –
● Sales and Operating Income –
● We increased our operating margins by maximizing our revenues relative to the rising live hog markets. In addition,
we had an improvement in our export sales. Operating results included an increase in incentive-based compensation.
● Derivative Activities – Operating results included the following amounts for commodity risk management activities
related to forward futures contracts for live hogs. These amounts exclude the impact from related physical sale and
purchase transactions, which impact current and future period operating results.
2010 – Loss $(36) million
2009 – Income 55 million
Decline in operating results ($91) million
2009 vs. 2008 –
● Sales and Operating Income –
● Operating results for fiscal 2009 were strong, but down when compared to the record year we had in fiscal 2008.
While sales volume was relatively flat versus fiscal 2008, results were negatively impacted by a decrease in our
average sales prices, which were only partially offset by the decrease in average live costs.
● Derivative Activities – Operating results included the following amounts for commodity risk management activities
related to forward futures contracts for live hogs. These amounts exclude the impact from related physical sale and
purchase transactions, which impact current and future period operating results.
2009 – Income $55 million
2008 – Income 95 million
Decline in operating results ($40) million