Tyson Foods 2010 Annual Report Download - page 23
Download and view the complete annual report
Please find page 23 of the 2010 Tyson Foods annual report below. You can navigate through the pages in the report by either clicking on the pages listed below, or by using the keyword search tool below to find specific information within the annual report.-
 1
1 -
2
-
3
-
4
-
5
-
6
-
7
-
8
-
9
-
10
-
11
-
12
-
 13
13 -
 14
14 -
 15
15 -
 16
16 -
 17
17 -
 18
18 -
 19
19 -
 20
20 -
 21
21 -
 22
22 -
 23
23 -
 24
24 -
 25
25 -
 26
26 -
 27
27 -
 28
28 -
 29
29 -
 30
30 -
 31
31 -
 32
32 -
 33
33 -
34
-
35
-
36
-
37
-
38
-
39
-
40
-
41
-
42
-
43
-
44
-
45
-
46
-
47
-
48
-
49
-
50
-
51
-
52
-
53
-
54
-
55
-
56
-
57
-
58
-
59
-
60
-
61
-
62
-
63
-
64
-
65
-
66
-
67
-
68
-
69
-
70
-
71
-
72
-
73
-
74
-
75
-
76
-
77
-
78
-
79
-
80
-
81
-
82
-
83
-
84
-
85
-
86
-
87
-
88
-
89
-
90
-
91
-
92
-
93
-
94
-
95
 |
 |

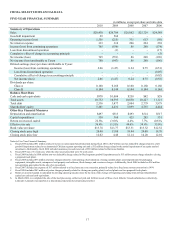
23
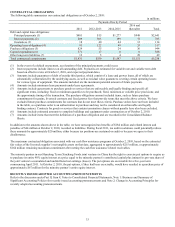
Effective Tax Rate
2010 2009 2008
36.4% (1.5)% 44.6%
The effective tax rate on continuing operations was impacted by a number of items which result in a difference between our effective
tax rate and the U.S. statutory rate of 35%. The table below reflects significant items impacting the rate as indicated.
2010 –
● Domestic production activity deduction reduced the rate 2.0%.
● Decrease in unrecognized tax benefits reduced the rate 1.4%.
● Decrease in state valuation allowances reduced the rate 1.0%.
● State income taxes, excluding unrecognized tax benefits, increased the rate 3.4%.
● Impairment of goodwill, which is not deductible for income tax purposes, increased the rate 0.9%.
2009 –
● Impairment of goodwill, which is not deductible for income tax purposes, reduced the rate 36.1%.
● Increase in foreign valuation allowances reduced the rate 3.8%.
● General business credits increased the rate 2.2%.
● Tax planning in foreign jurisdictions increased the rate 1.7%.
2008 –
● Increase in state valuation allowances increased the rate 5.0%.
● Increase in unrecognized tax benefits increased the rate 4.4%.
● Net negative return on company-owned life insurance policies, which is not deductible for federal income tax purposes,
increased the rate 3.8%.
● General business credits reduced the rate 3.8%.
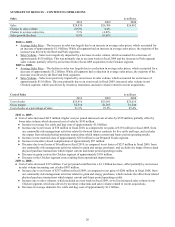
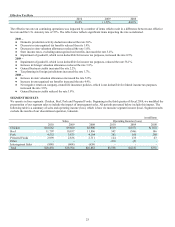
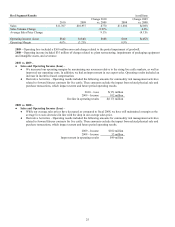
SEGMENT RESULTS
We operate in four segments: Chicken, Beef, Pork and Prepared Foods. Beginning in the third quarter of fiscal 2010, we modified the
presentation of our segment sales to include the impact of intersegment sales. All periods presented below include this impact. The
following table is a summary of sales and operating income (loss), which is how we measure segment income (loss). Segment results
exclude the results of our discontinued operation, Lakeside.
in millions
Sales Operating Income (Loss)
2010 2009 2008 2010 2009 2008
Chicken $10,062 $9,660 $8,900 $519 $(157) $(118)
Beef 11,707 10,937 11,806 542 (346) 106
Pork 4,552 3,875 4,104 381 160 280
Prepared Foods 2,999 2,836 2,711 124 133 63
Other - - - (10) (5) -
Intersegment Sales (890) (604) (659) - - -
Total $28,430 $26,704 $26,862 $1,556 $(215) $331