Tyson Foods 2010 Annual Report Download - page 66
Download and view the complete annual report
Please find page 66 of the 2010 Tyson Foods annual report below. You can navigate through the pages in the report by either clicking on the pages listed below, or by using the keyword search tool below to find specific information within the annual report.-
 1
1 -
2
-
3
-
4
-
5
-
6
-
7
-
8
-
9
-
10
-
11
-
12
-
13
-
14
-
15
-
16
-
17
-
18
-
19
-
20
-
21
-
22
-
23
-
24
-
25
-
26
-
27
-
28
-
29
-
30
-
31
-
32
-
33
-
34
-
35
-
36
-
37
-
38
-
39
-
40
-
41
-
42
-
43
-
44
-
45
-
46
-
47
-
48
-
49
-
50
-
51
-
52
-
53
-
54
-
55
-
 56
56 -
 57
57 -
 58
58 -
 59
59 -
 60
60 -
 61
61 -
 62
62 -
 63
63 -
 64
64 -
 65
65 -
 66
66 -
 67
67 -
 68
68 -
 69
69 -
 70
70 -
 71
71 -
 72
72 -
 73
73 -
 74
74 -
 75
75 -
 76
76 -
77
-
78
-
79
-
80
-
81
-
82
-
83
-
84
-
85
-
86
-
87
-
88
-
89
-
90
-
91
-
92
-
93
-
94
-
95
 |
 |

66
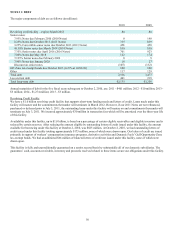
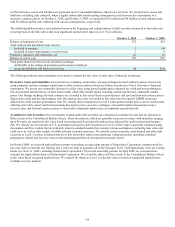
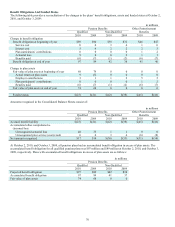
Other Financial Instruments
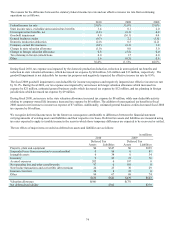
Fair values for debt are based on quoted market prices or published forward interest rate curves. Fair value and carrying value for our
debt were as follows (in millions):
October 2, 2010 October 3, 2009
Fair
Value
Carrying
Value
Fair
Value
Carrying
Value
Total Debt $2,770 $2,536 $3,724 $3,477
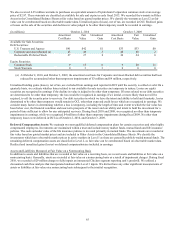
For all of our other financial instruments, the estimated fair value approximated the carrying value at October 2, 2010, and October 3,
2009. The carrying value of our other financial instruments, not otherwise disclosed herein, included notes receivable, which
approximated fair value at October 2, 2010, and October 3, 2009. Notes receivable were recorded in Other Current Assets in the
Consolidated Balance Sheets and totaled $49 million at October 2, 2010, and were recorded in Other Assets at October 3, 2009, and
totaled $45 million. The fair values were determined using pricing models for which the assumptions utilize management’s estimates
of market participant assumptions.
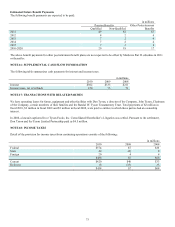
Concentrations of Credit Risk
Our financial instruments exposed to concentrations of credit risk consist primarily of cash and cash equivalents and accounts
receivable. Our cash equivalents are in high quality securities placed with major banks and financial institutions. Concentrations of
credit risk with respect to receivables are limited due to the large number of customers and their dispersion across geographic areas.
We perform periodic credit evaluations of our customers’ financial condition and generally do not require collateral. At October 2,
2010, and October 3, 2009, 15.3% and 13.0%, respectively, of our net accounts receivable balance was due from Wal-Mart Stores,
Inc. No other single customer or customer group represents greater than 10% of net accounts receivable.