Tyson Foods 2010 Annual Report Download - page 47
Download and view the complete annual report
Please find page 47 of the 2010 Tyson Foods annual report below. You can navigate through the pages in the report by either clicking on the pages listed below, or by using the keyword search tool below to find specific information within the annual report.
47
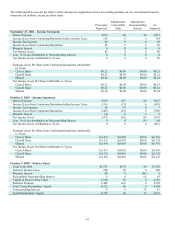
The following table presents the effects of the retrospective application of new accounting guidance on our consolidated financial
statements (in millions, except per share data):
Adjustments: Adjustments:
Previously Convertible Noncontrolling As
Reported Debt Interest Adjusted
September 27, 2008 – Income Statement:
Interest Expense $215 $0 $0 $215
Income (Loss) from Continuing Operations before Income Taxes 154 0 0 154
Income Tax Expense 68 0 0 68
Income (Loss) from Continuing Operations 86 0 0 86
Minority Interest 0 0 0 0
Net Income (Loss) 86 0 0 86
Less: Net Loss Attributable to Noncontrolling Interest 0 0 0 0
Net Income (Loss) Attributable to Tyson 0 0 0 86
Earnings (Loss) Per Share from Continuing Operations Attributable
to Tyson:
Class A Basic $0.25 $0.00 $0.00 $0.25
Class B Basic $0.22 $0.00 $0.00 $0.22
Diluted $0.24 $0.00 $0.00 $0.24
Net Income (Loss) Per Share Attributable to Tyson:
Class A Basic $0.25 $0.00 $0.00 $0.25
Class B Basic $0.22 $0.00 $0.00 $0.22
Diluted $0.24 $0.00 $0.00 $0.24
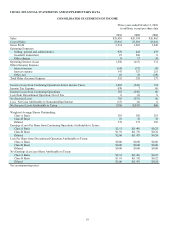
October 3, 2009 – Income Statement:
Interest Expense $310 $17 $0 $327
Income (Loss) from Continuing Operations before Income Taxes (526) (17) 0 (543)
Income Tax Expense 14 (7) 0 7
Income (Loss) from Continuing Operations (540) (10) 0 (550)
Minority Interest (4) 0 4 0
Net Income (Loss) (537) (10) (4) (551)
Less: Net Loss Attributable to Noncontrolling Interest 0 0 (4) (4)
Net Income (Loss) Attributable to Tyson 0 0 0 (547)
Earnings (Loss) Per Share from Continuing Operations Attributable
to Tyson:
Class A Basic $(1.47) $(0.02) $0.00 $(1.49)
Class B Basic $(1.32) $(0.03) $0.00 $(1.35)
Diluted $(1.44) $(0.03) $0.00 $(1.47)
Net Income (Loss) Per Share Attributable to Tyson:
Class A Basic $(1.47) $(0.02) $0.00 $(1.49)
Class B Basic $(1.32) $(0.03) $0.00 $(1.35)
Diluted $(1.44) $(0.03) $0.00 $(1.47)
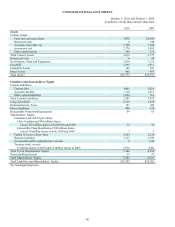
October 3, 2009 – Balance Sheet:
Long-Term Debt $3,333 $(75) $0 $3,258
Deferred Income Taxes 280 29 0 309
Minority Interest 98 0 (98) 0
Redeemable Noncontrolling Interest 0 0 65 65
Capital in Excess of Par Value 2,180 56 0 2,236
Retained Earnings 2,409 (10) 0 2,399
Total Tyson Shareholders’ Equity 4,352 46 0 4,398
Noncontrolling Interest 0 0 33 33
Total Shareholders’ Equity 4,352 46 33 4,431


