Tyson Foods 2010 Annual Report Download - page 42
Download and view the complete annual report
Please find page 42 of the 2010 Tyson Foods annual report below. You can navigate through the pages in the report by either clicking on the pages listed below, or by using the keyword search tool below to find specific information within the annual report.-
 1
1 -
2
-
3
-
4
-
5
-
6
-
7
-
8
-
9
-
10
-
11
-
12
-
13
-
14
-
15
-
16
-
17
-
18
-
19
-
20
-
21
-
22
-
23
-
24
-
25
-
26
-
27
-
28
-
29
-
30
-
31
-
 32
32 -
 33
33 -
 34
34 -
 35
35 -
 36
36 -
 37
37 -
 38
38 -
 39
39 -
 40
40 -
 41
41 -
 42
42 -
 43
43 -
 44
44 -
 45
45 -
 46
46 -
 47
47 -
 48
48 -
 49
49 -
 50
50 -
 51
51 -
 52
52 -
53
-
54
-
55
-
56
-
57
-
58
-
59
-
60
-
61
-
62
-
63
-
64
-
65
-
66
-
67
-
68
-
69
-
70
-
71
-
72
-
73
-
74
-
75
-
76
-
77
-
78
-
79
-
80
-
81
-
82
-
83
-
84
-
85
-
86
-
87
-
88
-
89
-
90
-
91
-
92
-
93
-
94
-
95
 |
 |

42
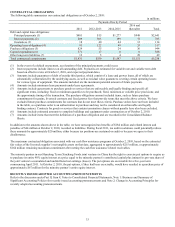
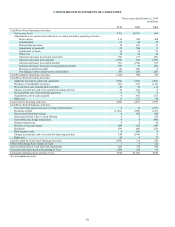
CONSOLIDATED STATEMENTS OF CASH FLOWS
Three years ended October 2, 2010
in millions
2010 2009 2008
Cash Flows From Operating Activities:
Net income (loss) $765 $(551) $86
Adjustments to reconcile net income (loss) to cash provided by operating activities:
Depreciation 416 445 468
Amortization 81 68 25
Deferred income taxes 18 (33) 35
Impairment of goodwill 29 560 0
Impairment of assets 36 32 57
Other, net 76 72 26
(Increase) decrease in accounts receivable (79) 137 (59)
(Increase) decrease in inventories (239) 493 (376)
Increase (decrease) in accounts payable 101 (216) 165
Increase (decrease) in income taxes payable/receivable (53) 33 (22)
Decrease in interest payable (4) (60) 0
Net change in other current assets and liabilities 285 (20) (50)
Cash Provided by Operating Activities 1,432 960 355
Cash Flows From Investing Activities:
Additions to property, plant and equipment (550) (368) (425)
Purchases of marketable securities (53) (37) (115)
Proceeds from sale of marketable securities 49 56 112
Change in restricted cash to be used for investing activities 43 (43) 0
Proceeds from sale of discontinued operation 0 75 0
Acquisitions, net of cash acquired 0 (93) (17)
Other, net 11 (17) 46
Cash Used for Investing Activities (500) (427) (399)
Cash Flows From Financing Activities:
Net borrowings (payments) on revolving credit facilities 0 15 (213)
Payments of debt (1,034) (380) (147)
Net proceeds from borrowings 0 852 449
Net proceeds from Class A stock offering 0 0 274
Convertible note hedge transactions 0 0 (94)
Warrant transactions 0 0 44
Purchase of treasury shares (48) (19) (30)
Dividends (59) (60) (56)
Debt issuance costs 0 (59) 0
Change in restricted cash to be used for financing activities 140 (140) 0
Other, net 42 6 27
Cash Provided by (Used for) Financing Activities (959) 215 254
Effect of Exchange Rate Change on Cash 1 6 (2)
Increase (Decrease) in Cash and Cash Equivalents (26) 754 208
Cash and Cash Equivalents at Beginning of Year 1,004 250 42
Cash and Cash Equivalents at End of Year $978 $1,004 $250
See accompanying notes.