Tyson Foods 2010 Annual Report Download - page 53
Download and view the complete annual report
Please find page 53 of the 2010 Tyson Foods annual report below. You can navigate through the pages in the report by either clicking on the pages listed below, or by using the keyword search tool below to find specific information within the annual report.-
 1
1 -
2
-
3
-
4
-
5
-
6
-
7
-
8
-
9
-
10
-
11
-
12
-
13
-
14
-
15
-
16
-
17
-
18
-
19
-
20
-
21
-
22
-
23
-
24
-
25
-
26
-
27
-
28
-
29
-
30
-
31
-
32
-
33
-
34
-
35
-
36
-
37
-
38
-
39
-
40
-
41
-
42
-
 43
43 -
 44
44 -
 45
45 -
 46
46 -
 47
47 -
 48
48 -
 49
49 -
 50
50 -
 51
51 -
 52
52 -
 53
53 -
 54
54 -
 55
55 -
 56
56 -
 57
57 -
 58
58 -
 59
59 -
 60
60 -
 61
61 -
 62
62 -
 63
63 -
64
-
65
-
66
-
67
-
68
-
69
-
70
-
71
-
72
-
73
-
74
-
75
-
76
-
77
-
78
-
79
-
80
-
81
-
82
-
83
-
84
-
85
-
86
-
87
-
88
-
89
-
90
-
91
-
92
-
93
-
94
-
95
 |
 |
53
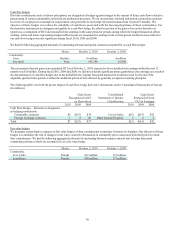
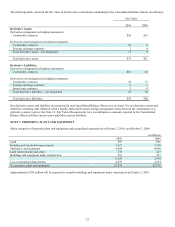
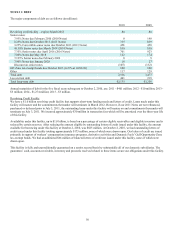
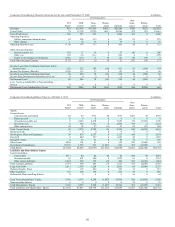
The following table sets forth the fair value of all derivative instruments outstanding in the Consolidated Balance Sheets (in millions):
Fair Value
2010 2009
Derivative Assets:
Derivatives designated as hedging instruments:
Commodity contracts $20 $12
Derivatives not designated as hedging instruments:
Commodity contracts 10 9
Foreign exchange contracts 1 0
Total derivative assets – not designated 11 9
Total derivative assets $31 $21
Derivative Liabilities:
Derivatives designated as hedging instruments:
Commodity contracts $16 $2
Derivatives not designated as hedging instruments:
Commodity contracts 34 13
Foreign exchange contracts 6 1
Interest rate contracts 3 4
Total derivative liabilities – not designated 43 18
Total derivative liabilities $59 $20
Our derivative assets and liabilities are presented in our Consolidated Balance Sheets on a net basis. We net derivative assets and
liabilities, including cash collateral when a legally enforceable master netting arrangement exists between the counterparty to a
derivative contract and us. See Note 12: Fair Value Measurements for a reconciliation to amounts reported in the Consolidated
Balance Sheets in Other current assets and Other current liabilities.
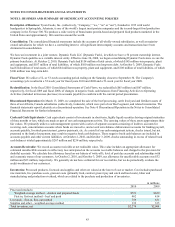
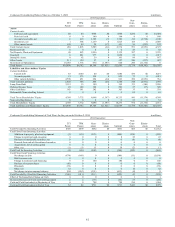
NOTE 7: PROPERTY, PLANT AND EQUIPMENT
Major categories of property, plant and equipment and accumulated depreciation at October 2, 2010, and October 3, 2009:
in millions
2010 2009
Land $97 $96
Building and leasehold improvements 2,617 2,570
Machinery and equipment 4,694 4,640
Land improvements and other 232 227
Buildings and equipment under construction 513 297
8,153 7,830
Less accumulated depreciation 4,479 4,254
Net property, plant and equipment $3,674 $3,576
Approximately $388 million will be required to complete buildings and equipment under construction at October 2, 2010.