Tyson Foods 2010 Annual Report Download - page 41
Download and view the complete annual report
Please find page 41 of the 2010 Tyson Foods annual report below. You can navigate through the pages in the report by either clicking on the pages listed below, or by using the keyword search tool below to find specific information within the annual report.-
 1
1 -
2
-
3
-
4
-
5
-
6
-
7
-
8
-
9
-
10
-
11
-
12
-
13
-
14
-
15
-
16
-
17
-
18
-
19
-
20
-
21
-
22
-
23
-
24
-
25
-
26
-
27
-
28
-
29
-
30
-
 31
31 -
 32
32 -
 33
33 -
 34
34 -
 35
35 -
 36
36 -
 37
37 -
 38
38 -
 39
39 -
 40
40 -
 41
41 -
 42
42 -
 43
43 -
 44
44 -
 45
45 -
 46
46 -
 47
47 -
 48
48 -
 49
49 -
 50
50 -
 51
51 -
52
-
53
-
54
-
55
-
56
-
57
-
58
-
59
-
60
-
61
-
62
-
63
-
64
-
65
-
66
-
67
-
68
-
69
-
70
-
71
-
72
-
73
-
74
-
75
-
76
-
77
-
78
-
79
-
80
-
81
-
82
-
83
-
84
-
85
-
86
-
87
-
88
-
89
-
90
-
91
-
92
-
93
-
94
-
95
 |
 |

41
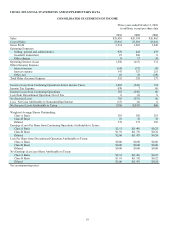
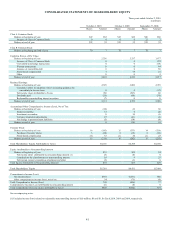
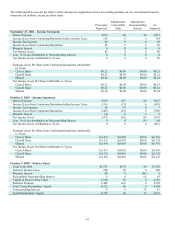
CONSOLIDATED STATEMENTS OF SHAREHOLDERS' EQUITY
Three years ended October 2, 2010
in millions
October 2, 2010 October 3, 2009 September 27, 2008
Shares Amount Shares Amount Shares Amount
Class A Common Stock:
Balance at beginning of year 322 $32 322 $32 300 $30
Issuance of Class A Common Stock 0 0 0 0 22 2
Balance at end of year 322 32 322 32 322 32
Class B Common Stock:
Balance at beginning and end of year 70 7 70 7 70 7
Capital in Excess of Par Value:
Balance at beginning of year 2,236 2,217 1,877
Issuance of Class A Common Stock 0 0 272
Convertible note hedge transactions 0 0 (58)
Warrant transactions 0 0 44
Issuance of convertible debt 0 0 56
Stock-based compensation 7 19 21
Other 0 0 5
Balance at end of year 2,243 2,236 2,217
Retained Earnings:
Balance at beginning of year 2,399 3,006 2,993
Cumulative effect for adoption of new accounting guidance for
uncertainty in income taxes 0 0 (17)
Net income (loss) attributable to Tyson 780 (547) 86
Dividends paid (59) (60) (56)
Redeemable noncontrolling interest accretion (7) 0 0
Balance at end of year 3,113 2,399 3,006
Accumulated Other Comprehensive Income (Loss), Net of Tax:
Balance at beginning of year (34) 41 50
Hedge accounting 12 6 (2)
Investment accounting 0 10 (1)
Currency translation adjustments 27 (81) (2)
Net change in postretirement liabilities (5) (10) (4)
Balance at end of year 0 (34) 41
Treasury Stock:
Balance at beginning of year 16 (242) 15 (233) 14 (226)
Purchase of treasury shares 3 (48) 2 (19) 2 (30)
Stock-based compensation (4) 61 (1) 10 (1) 23
Balance at end of year 15 (229) 16 (242) 15 (233)
Total Shareholders’ Equity Attributable to Tyson $5,166 $4,398 $5,070
Equity Attributable to Noncontrolling Interests
Balance at beginning of year $33 $29 $4
Net income (loss) attributable to noncontrolling interests (1) (6) (4) 0
Contributions by (distributions to) noncontrolling interest 10 9 25
Net foreign currency translation adjustment and other (2) (1) 0
Total Equity Attributable to Noncontrolling Interests $35 $33 $29
Total Shareholders’ Equity $5,201 $4,431 $5,099
Comprehensive Income (Loss):
Net income (loss) $765 $(551) $86
Other comprehensive income (loss), net of tax 34 (75) (9)
Total Comprehensive Income (Loss) 799 (626) 77
Comprehensive Income (Loss) attributable to noncontrolling interest (6) (4) 0
Total Comprehensive Income (Loss) attributable to Tyson $805 $(622) $77
See accompanying notes.
(1) Excludes income (loss) related to redeemable noncontrolling interest of $(9) million, $0 and $0, for fiscal 2010, 2009 and 2008, respectively.