Tyson Foods 2010 Annual Report Download - page 60
Download and view the complete annual report
Please find page 60 of the 2010 Tyson Foods annual report below. You can navigate through the pages in the report by either clicking on the pages listed below, or by using the keyword search tool below to find specific information within the annual report.-
 1
1 -
2
-
3
-
4
-
5
-
6
-
7
-
8
-
9
-
10
-
11
-
12
-
13
-
14
-
15
-
16
-
17
-
18
-
19
-
20
-
21
-
22
-
23
-
24
-
25
-
26
-
27
-
28
-
29
-
30
-
31
-
32
-
33
-
34
-
35
-
36
-
37
-
38
-
39
-
40
-
41
-
42
-
43
-
44
-
45
-
46
-
47
-
48
-
49
-
 50
50 -
 51
51 -
 52
52 -
 53
53 -
 54
54 -
 55
55 -
 56
56 -
 57
57 -
 58
58 -
 59
59 -
 60
60 -
 61
61 -
 62
62 -
 63
63 -
 64
64 -
 65
65 -
 66
66 -
 67
67 -
 68
68 -
 69
69 -
 70
70 -
71
-
72
-
73
-
74
-
75
-
76
-
77
-
78
-
79
-
80
-
81
-
82
-
83
-
84
-
85
-
86
-
87
-
88
-
89
-
90
-
91
-
92
-
93
-
94
-
95
 |
 |

60
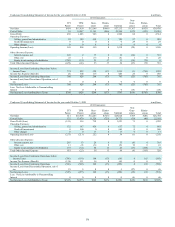
Condensed Consolidating Statement of Income for the year ended September 27, 2008 in millions
2014 Guarantors
TFI
Parent
TFM
Parent
Guar-
antors
Elimin-
ations Subtotal
Non-
Guar-
antors
Elimin-
ations Total
Net Sales $19 $15,638 $11,463 $(811) $26,290 $580 $(27) $26,862
Cost of Sales 74 15,105 10,796 (811) 25,090 479 (27) 25,616
Gross Profit (Loss) (55) 533 667 0 1,200 101 0 1,246
Operating Expenses:
Selling, general and administrative 83 208 533 0 741 55 0 879
Other charges 1 18 17 0 35 0 0 36
Operating Income (Loss) (139) 307 117 0 424 46 0 331
Other (Income) Expense:
Interest expense, net 181 17 16 0 33 (8) 0 206
Other, net (13) (5) (11) 0 (16) 0 0 (29)
Equity in net earnings of subsidiaries (285) (27) 5 18 (4) (9) 298 0
Total Other (Income) Expense (117) (15) 10 18 13 (17) 298 177
Income (Loss) from Continuing Operations before
Income Taxes (22) 322 107 (18) 411 63 (298) 154
Income Tax Expense (Benefit) (108) 116 37 0 153 23 0 68
Income (Loss) from Continuing Operations 86 206 70 (18) 258 40 (298) 86
Income from Discontinued Operation, net of tax 0 0 0 0 0 0 0 0
Net Income (Loss) 86 206 70 (18) 258 40 (298) 86
Less: Net Loss Attributable to Noncontrolling
Interest 0 0 0 0 0 0 0 0
Net Income (Loss) Attributable to Tyson $86 $206 $70 $(18) $258 $40 $(298) $86
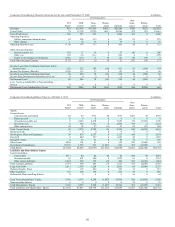
Condensed Consolidating Balance Sheet as of October 2, 2010 in millions
2014 Guarantors
TFI
Parent
TFM
Parent
Guar-
antors
Elimin-
ations Subtotal
Non-
Guar-
antors
Elimin-
ations Total
Assets
Current Assets:
Cash and cash equivalents $2 $2 $731 $0 $733 $243 $0 $978
Restricted cash 0 0 0 0 0 0 0 0
Accounts receivable, net 0 2,389 4,670 0 7,059 132 (5,993) 1,198
Inventories, net 0 734 1,361 0 2,095 179 0 2,274
Other current assets 43 49 27 (9) 67 95 (37) 168
Total Current Assets 45 3,174 6,789 (9) 9,954 649 (6,030) 4,618
Restricted Cash 0 0 0 0 0 0 0 0
Net Property, Plant and Equipment 39 870 2,257 0 3,127 508 0 3,674
Goodwill 0 880 967 0 1,847 46 0 1,893
Intangible Assets 0 37 53 0 90 76 0 166
Other Assets 2,804 101 61 0 162 295 (2,860) 401
Investment in Subsidiaries 10,776 1,785 631 (1,607) 809 307 (11,892) 0
Total Assets $13,664 $6,847 $10,758 $(1,616) $15,989 $1,881 $(20,782) $10,752
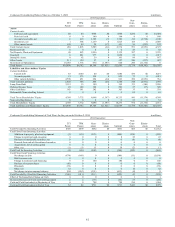
Liabilities and Shareholders’ Equity
Current Liabilities:
Current debt $317 $0 $0 $0 $0 $84 $0 $401
Accounts payable 16 421 608 0 1,029 65 0 1,110
Other current liabilities 6,044 168 335 (9) 494 526 (6,030) 1,034
Total Current Liabilities 6,377 589 943 (9) 1,523 675 (6,030) 2,545
Long-Term Debt 2,011 1,638 1,228 0 2,866 118 (2,860) 2,135
Deferred Income Taxes 0 105 204 0 309 12 0 321
Other Liabilities 110 148 179 0 327 49 0 486
Redeemable Noncontrolling Interest 0 0 0 0 0 64 0 64
Total Tyson Shareholders’ Equity 5,166 4,367 8,204 (1,607) 10,964 928 (11,892) 5,166
Noncontrolling Interest 0 0 0 0 0 35 0 35
Total Shareholders’ Equity 5,166 4,367 8,204 (1,607) 10,964 963 (11,892) 5,201
Total Liabilities and Shareholders’ Equity $13,664 $6,847 $10,758 $(1,616) $15,989 $1,881 $(20,782) $10,752