Tyson Foods 2010 Annual Report Download - page 62
Download and view the complete annual report
Please find page 62 of the 2010 Tyson Foods annual report below. You can navigate through the pages in the report by either clicking on the pages listed below, or by using the keyword search tool below to find specific information within the annual report.-
 1
1 -
2
-
3
-
4
-
5
-
6
-
7
-
8
-
9
-
10
-
11
-
12
-
13
-
14
-
15
-
16
-
17
-
18
-
19
-
20
-
21
-
22
-
23
-
24
-
25
-
26
-
27
-
28
-
29
-
30
-
31
-
32
-
33
-
34
-
35
-
36
-
37
-
38
-
39
-
40
-
41
-
42
-
43
-
44
-
45
-
46
-
47
-
48
-
49
-
50
-
51
-
 52
52 -
 53
53 -
 54
54 -
 55
55 -
 56
56 -
 57
57 -
 58
58 -
 59
59 -
 60
60 -
 61
61 -
 62
62 -
 63
63 -
 64
64 -
 65
65 -
 66
66 -
 67
67 -
 68
68 -
 69
69 -
 70
70 -
 71
71 -
 72
72 -
73
-
74
-
75
-
76
-
77
-
78
-
79
-
80
-
81
-
82
-
83
-
84
-
85
-
86
-
87
-
88
-
89
-
90
-
91
-
92
-
93
-
94
-
95
 |
 |

62
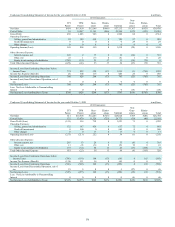
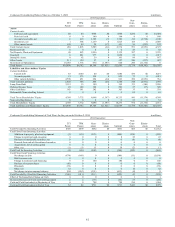
Condensed Consolidating Statement of Cash Flows for the year ended October 3, 2009 in millions
2014 Guarantors
TFI
Parent
TFM
Parent
Guar-
antors
Elimin-
ations Subtotal
Non-
Guar-
antors
Elimin-
ations Total
Cash Provided by (Used for) Operating Activities $(617) $507 $982 $0 $1,489 $113 $(25) $960
Cash Flows From Investing Activities:
Additions to property, plant and equipment 0 (56) (211) 0 (267) (101) 0 (368)
Change in restricted cash-investing 0 0 0 0 0 (43) 0 (43)
Proceeds from sale of marketable securities, net 0 0 0 0 0 19 0 19
Proceeds from sale of discontinued operation 0 0 0 0 0 75 0 75
Acquisitions, net of cash acquired 0 0 (13) 0 (13) (80) 0 (93)
Other, net (37) 1 12 0 13 7 0 (17)
Cash Used for Investing Activities (37) (55) (212) 0 (267) (123) 0 (427)
Cash Flows from Financing Activities:
Net change in debt 545 (94) 0 0 (94) 36 0 487
Debt issuance costs (58) 0 0 0 0 (1) 0 (59)
Change in restricted cash-financing 0 0 (140) 0 (140) 0 0 (140)
Purchase of treasury shares (19) 0 0 0 0 0 0 (19)
Dividends (60) 0 0 0 0 (25) 25 (60)
Other, net 0 0 0 0 0 6 0 6
Net change in intercompany balances 106 (358) 123 0 (235) 129 0 0
Cash Provided by (Used for) Financing Activities 514 (452) (17) 0 (469) 145 25 215
Effect of Exchange Rate Change on Cash 0 0 0 0 0 6 0 6
Increase (Decrease) in Cash and Cash Equivalents (140) 0 753 0 753 141 0 754
Cash and Cash Equivalents at Beginning of Year 140 0 35 0 35 75 0 250
Cash and Cash Equivalents at End of Year $0 $0 $788 $0 $788 $216 $0 $1,004
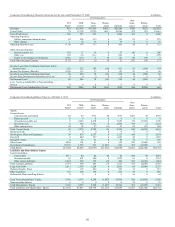
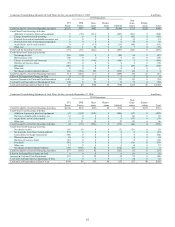
Condensed Consolidating Statement of Cash Flows for the year ended September 27, 2008 in millions
2014 Guarantors
TFI
Parent
TFM
Parent
Guar-
antors
Elimin-
ations Subtotal
Non-
Guar-
antors
Elimin-
ations Total
Cash Provided by (Used for) Operating Activities $(164) $278 $256 $0 $534 $0 $(15) $355
Cash Flows From Investing Activities:
Additions to property, plant and equipment (2) (104) (302) 0 (406) (17) 0 (425)
Purchases of marketable securities, net (1) 0 0 0 0 (2) 0 (3)
Acquisitions, net of cash acquired 0 0 0 0 0 (17) 0 (17)
Other, net 27 11 16 0 27 (8) 0 46
Cash Provided by (Used for) Investing Activities 24 (93) (286) 0 (379) (44) 0 (399)
Cash Flows from Financing Activities:
Net change in debt 145 (5) 0 0 (5) (51) 0 89
Net proceeds from Class A stock offering 274 0 0 0 0 0 0 274
Convertible note hedge transactions (94) 0 0 0 0 0 0 (94)
Warrant transactions 44 0 0 0 0 0 0 44
Purchase of treasury shares (30) 0 0 0 0 0 0 (30)
Dividends (56) 0 0 0 0 (15) 15 (56)
Other, net 13 0 0 0 0 14 0 27
Net change in intercompany balances (19) (180) 62 0 (118) 137 0 0
Cash Provided by (Used for) Financing Activities 277 (185) 62 0 (123) 85 15 254
Effect of Exchange Rate Change on Cash 0 0 0 0 0 (2) 0 (2)
Increase in Cash and Cash Equivalents 137 0 32 0 32 39 0 208
Cash and Cash Equivalents at Beginning of Year 3 0 3 0 3 36 0 42
Cash and Cash Equivalents at End of Year $140 $0 $35 $0 $35 $75 $0 $250