Tyson Foods 2010 Annual Report Download - page 17
Download and view the complete annual report
Please find page 17 of the 2010 Tyson Foods annual report below. You can navigate through the pages in the report by either clicking on the pages listed below, or by using the keyword search tool below to find specific information within the annual report.-
 1
1 -
2
-
3
-
4
-
5
-
6
-
 7
7 -
 8
8 -
 9
9 -
 10
10 -
 11
11 -
 12
12 -
 13
13 -
 14
14 -
 15
15 -
 16
16 -
 17
17 -
 18
18 -
 19
19 -
 20
20 -
 21
21 -
 22
22 -
 23
23 -
 24
24 -
 25
25 -
 26
26 -
 27
27 -
28
-
29
-
30
-
31
-
32
-
33
-
34
-
35
-
36
-
37
-
38
-
39
-
40
-
41
-
42
-
43
-
44
-
45
-
46
-
47
-
48
-
49
-
50
-
51
-
52
-
53
-
54
-
55
-
56
-
57
-
58
-
59
-
60
-
61
-
62
-
63
-
64
-
65
-
66
-
67
-
68
-
69
-
70
-
71
-
72
-
73
-
74
-
75
-
76
-
77
-
78
-
79
-
80
-
81
-
82
-
83
-
84
-
85
-
86
-
87
-
88
-
89
-
90
-
91
-
92
-
93
-
94
-
95
 |
 |

17
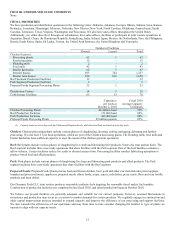
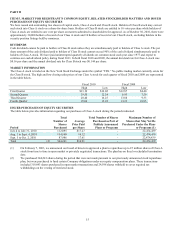
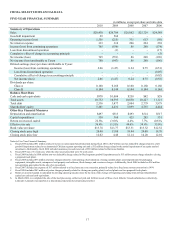
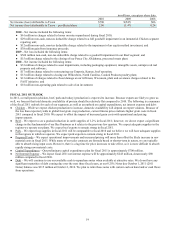
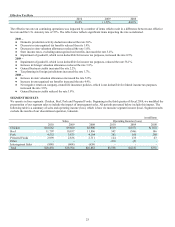
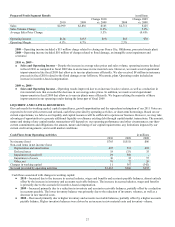
ITEM 6. SELECTED FINANCIAL DATA
FIVE-YEAR FINANCIAL SUMMARY
in millions, except per share and ratio data
2010 2009 2008 2007 2006
Summary of Operations
Sales $28,430 $26,704 $26,862 $25,729 $24,589
Goodwill impairment 29 560 - - -
Operating income (loss) 1,556 (215) 331 613 (50)
Net interest expense 333 310 206 224 238
Income (loss) from continuing operations 765 (550) 86 268 (174)
Loss from discontinued operation - (1) - - (17)
Cumulative effect of change in accounting principle - - - - (5)
Net income (loss) 765 (551) 86 268 (196)
Net income (loss) attributable to Tyson 780 (547) 86 268 (196)
Diluted earnings (loss) per share attributable to Tyson:
Income (loss) from continuing operations 2.06 (1.47) 0.24 0.75 (0.51)
Loss from discontinued operation - - - - (0.05)
Cumulative effect of change in accounting principle - - - - (0.02)
Net income (loss) 2.06 (1.47) 0.24 0.75 (0.58)
Dividends per share:
Class A 0.160 0.160 0.160 0.160 0.160
Class B 0.144 0.144 0.144 0.144 0.144
Balance Sheet Data
Cash and cash equivalents $978 $1,004 $250 $42 $28
Total assets 10,752 10,595 10,850 10,227 11,121
Total debt 2,536 3,477 2,804 2,779 3,979
Shareholders' equity 5,201 4,431 5,099 4,735 4,444
Other Key Financial Measures
Depreciation and amortization $497 $513 $493 $514 $517
Capital expenditures 550 368 425 285 531
Return on invested capital 22.8% (3.0)% 4.4% 7.7% (0.6)%
Effective tax rate 36.4% (1.5)% 44.6% 34.6% 35.0%
Book value per share $13.78 $11.77 $13.51 $13.32 $12.52
Closing stock price high 20.40 13.88 19.44 24.08 18.70
Closing stock price low 12.02 4.40 12.14 14.20 12.92
Notes to Five-Year Financial Summary
a. Fiscal 2010 included $61 million related to losses on notes repurchased/redeemed during fiscal 2010, a $29 million non-tax deductible charge related to a full
goodwill impairment related to an immaterial Chicken segment reporting unit and a $12 million charge related to the partial impairment of an equity method
investment. Additionally, fiscal 2010 included insurance proceeds received of $38 million related to Hurricane Katrina.
b. Fiscal 2009 was a 53-week year, while the other years presented were 52-week years.
c. Fiscal 2009 included a $560 million non-tax deductible charge related to Beef segment goodwill impairment and a $15 million pretax charge related to closing
a prepared foods plant.
d. Fiscal 2008 included $76 million of pretax charges related to: restructuring a beef operation; closing a poultry plant; asset impairments for packaging
equipment, intangible assets, unimproved real property and software; flood damage; and severance charges. Additionally, fiscal 2008 included an $18 million
non-operating gain related to the sale of an investment.
e. Fiscal 2007 included tax expense of $17 million related to a fixed asset tax cost correction, primarily related to a fixed asset system conversion in 1999.
f. Fiscal 2006 included $63 million of pretax charges primarily related to closing one poultry plant, two beef plants and two prepared foods plants.
g. Return on invested capital is calculated by dividing operating income (loss) by the sum of the average of beginning and ending total debt and shareholders’
equity less cash and cash equivalents.
h. In March 2009, we completed the sale of the beef processing, cattle feed yard and fertilizer assets of three of our Alberta, Canada subsidiaries (collectively,
Lakeside). Lakeside was reported as a discontinued operation for all periods presented.