Tyson Foods 2010 Annual Report Download - page 64
Download and view the complete annual report
Please find page 64 of the 2010 Tyson Foods annual report below. You can navigate through the pages in the report by either clicking on the pages listed below, or by using the keyword search tool below to find specific information within the annual report.-
 1
1 -
2
-
3
-
4
-
5
-
6
-
7
-
8
-
9
-
10
-
11
-
12
-
13
-
14
-
15
-
16
-
17
-
18
-
19
-
20
-
21
-
22
-
23
-
24
-
25
-
26
-
27
-
28
-
29
-
30
-
31
-
32
-
33
-
34
-
35
-
36
-
37
-
38
-
39
-
40
-
41
-
42
-
43
-
44
-
45
-
46
-
47
-
48
-
49
-
50
-
51
-
52
-
53
-
 54
54 -
 55
55 -
 56
56 -
 57
57 -
 58
58 -
 59
59 -
 60
60 -
 61
61 -
 62
62 -
 63
63 -
 64
64 -
 65
65 -
 66
66 -
 67
67 -
 68
68 -
 69
69 -
 70
70 -
 71
71 -
 72
72 -
 73
73 -
 74
74 -
75
-
76
-
77
-
78
-
79
-
80
-
81
-
82
-
83
-
84
-
85
-
86
-
87
-
88
-
89
-
90
-
91
-
92
-
93
-
94
-
95
 |
 |

64
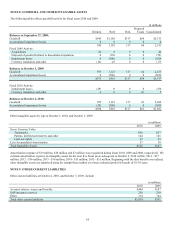
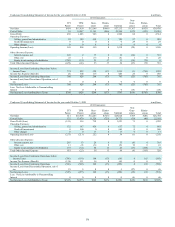
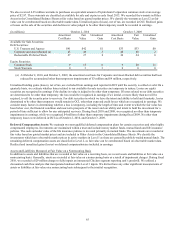
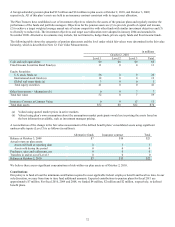
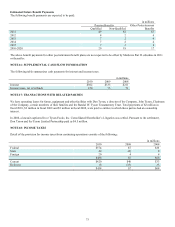
(a) Our derivative assets and liabilities are presented in our Consolidated Balance Sheets on a net basis. We net derivative assets and
liabilities, including cash collateral, when a legally enforceable master netting arrangement exists between the counterparty to a
derivative contract and us. At October 2, 2010, and October 3, 2009, we had posted $35 million and $4 million of cash collateral and
held $3 million and $0 cash collateral with various counterparties, respectively.
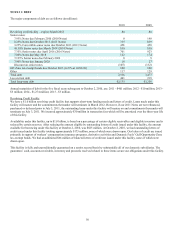
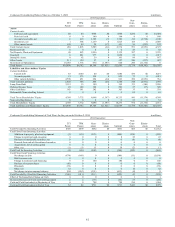
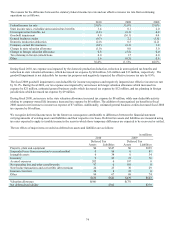
The following table provides a reconciliation between the beginning and ending balance of debt securities measured at fair value on a
recurring basis in the table above that used significant unobservable inputs (Level 3) (in millions):
October 2, 2010 October 3, 2009
Balance at beginning of year $72 $54
Total realized and unrealized gains (losses):
Included in earnings 1 (4)
Included in other comprehensive income (loss) 1 4
Purchases, issuances and settlements, net (1) 18
Balance at end of year $73 $72
Total gains (losses) for the periods included in earnings
attributable to the change in unrealized gains (losses) relating to
assets and liabilities still held at end of year $0 $(4)
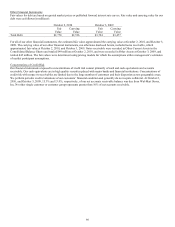
The following methods and assumptions were used to estimate the fair value of each class of financial instrument:
Derivative Assets and Liabilities: Our derivatives, including commodities, foreign exchange forward contracts and an interest rate
swap, primarily include exchange-traded and over-the-counter contracts which are further described in Note 6: Derivative Financial
Instruments. We record our commodity derivatives at fair value using quoted market prices adjusted for credit and non-performance
risk and internal models that use as their basis readily observable market inputs including current and forward commodity market
prices. Our foreign exchange forward contracts are recorded at fair value based on quoted prices and spot and forward currency prices
adjusted for credit and non-performance risk. Our interest rate swap is recorded at fair value based on quoted LIBOR swap rates
adjusted for credit and non-performance risk. We classify these instruments in Level 2 when quoted market prices can be corroborated
utilizing observable current and forward commodity market prices on active exchanges, observable market transactions of spot
currency rates and forward currency prices or observable benchmark market rates at commonly quoted intervals.
Available for Sale Securities: Our investments in marketable debt securities are classified as available-for-sale and are included in
Other Assets in the Consolidated Balance Sheets. These investments, which are generally long-term in nature with maturities ranging
up to 46 years, are reported at fair value based on pricing models and quoted market prices adjusted for credit and non-performance
risk. We classify our investments in U.S. government and agency debt securities as Level 2 as fair value is generally estimated using
discounted cash flow models that are primarily industry-standard models that consider various assumptions, including time value and
yield curve as well as other readily available relevant economic measures. We classify certain corporate, asset-backed and other debt
securities as Level 3 as there is limited activity or less observable inputs into proprietary valuation models, including estimated
prepayment, default and recovery rates on the underlying portfolio or structured investment vehicle.
In October 2008, we received eight million warrants to purchase an equivalent amount of Syntroleum Corporation common stock for
one cent each in return for our entering into a letter of credit to guarantee all of the Dynamic Fuels’ Gulf Opportunity Zone tax-exempt
bonds (see Note 11: Debt), including Syntroleum Corporation’s 50 percent ownership portion. In April 2009, we exercised these
warrants for eight million shares of Syntroleum Corporation. We record the shares in Other Assets in the Consolidated Balance Sheets
at fair value based on quoted market prices. We classify the shares as Level 1 as the fair value is based on unadjusted quoted prices
available in active markets.