Tyson Foods 2010 Annual Report Download - page 52
Download and view the complete annual report
Please find page 52 of the 2010 Tyson Foods annual report below. You can navigate through the pages in the report by either clicking on the pages listed below, or by using the keyword search tool below to find specific information within the annual report.-
 1
1 -
2
-
3
-
4
-
5
-
6
-
7
-
8
-
9
-
10
-
11
-
12
-
13
-
14
-
15
-
16
-
17
-
18
-
19
-
20
-
21
-
22
-
23
-
24
-
25
-
26
-
27
-
28
-
29
-
30
-
31
-
32
-
33
-
34
-
35
-
36
-
37
-
38
-
39
-
40
-
41
-
 42
42 -
 43
43 -
 44
44 -
 45
45 -
 46
46 -
 47
47 -
 48
48 -
 49
49 -
 50
50 -
 51
51 -
 52
52 -
 53
53 -
 54
54 -
 55
55 -
 56
56 -
 57
57 -
 58
58 -
 59
59 -
 60
60 -
 61
61 -
 62
62 -
63
-
64
-
65
-
66
-
67
-
68
-
69
-
70
-
71
-
72
-
73
-
74
-
75
-
76
-
77
-
78
-
79
-
80
-
81
-
82
-
83
-
84
-
85
-
86
-
87
-
88
-
89
-
90
-
91
-
92
-
93
-
94
-
95
 |
 |

52
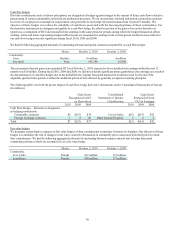
The objective of our undesignated interest rate swap is to manage interest rate risk exposure on a floating-rate bond. Our interest rate
swap agreement effectively modifies our exposure to interest rate risk by converting a portion of the floating-rate bond to a fixed rate
basis for the first five years, thus reducing the impact of the interest-rate changes on future interest expense. This interest rate swap
does not qualify for hedge treatment due to differences in the underlying bond and swap contract interest-rate indices.
We had the following aggregate outstanding notionals related to our undesignated positions:
Metric October 2, 2010 October 3, 2009
Commodity:
Corn Bushels 38 million 11 million
Soy meal Tons 367,000 73,000
Live Cattle Pounds 73 million 82 million
Lean Hogs Pounds 134 million 11 million
Natural Gas British thermal units 450 billion 850 billion
Foreign Currency United States dollars $146 million $124 million
Interest Rate Average monthly notional debt $53 million $64 million
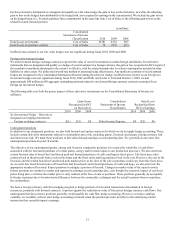
Included in our undesignated positions are certain commodity grain positions (which do not qualify for hedge treatment) we enter into
to manage the risk of costs associated with forward sales to certain customers for which sales prices are determined under cost-plus
arrangements. These unrealized positions totaled gains of $2 million and losses of $17 million at October 2, 2010, and October 3,
2009, respectively. When these positions are liquidated, we expect any realized gains or losses will be reflected in the prices of the
poultry products sold. Since these derivative positions did not qualify for hedge treatment, they initially created volatility in our
earnings associated with changes in fair value. However, once the positions were liquidated and included in the sales price to the
customer, there was ultimately no earnings impact as any previous fair value gains or losses were included in the prices of the poultry
products.
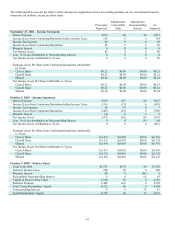
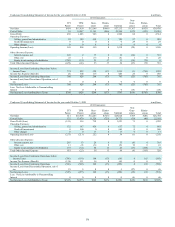
The following table sets forth the pretax impact of the undesignated derivative instruments on the Consolidated Statements of Income
(in millions):
Consolidated Gain/(Loss)
Statements of Income Recognized
Classification in Earnings
2010 2009 2008
Derivatives not designated
as hedging instruments:
Commodity contracts Sales $27 $(34) $(12)
Commodity contracts Cost of Sales (20) (151) 259
Foreign exchange contracts Other Income/Expense (5) 0 1
Interest rate contracts Interest Expense 1 (4) 0
Total $3 $(189) $248