Supercuts 2002 Annual Report Download - page 173
Download and view the complete annual report
Please find page 173 of the 2002 Supercuts annual report below. You can navigate through the pages in the report by either clicking on the pages listed below, or by using the keyword search tool below to find specific information within the annual report.Regis Corporation
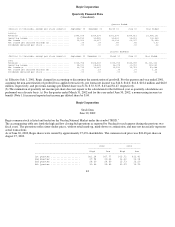
Quarterly Financial Data
(Unaudited)
(a) Effective July 1, 2001, Regis changed its accounting to discontinue the amortization of goodwill. For the quarters and year ended 2001,
assuming the non-amortization of goodwill was applied retroactively, pro forma net income was $14.8, $14.0, $14.8, $18.4 million and $62.0
million, respectively, and pro forma earnings per diluted share was $.36, $.33, $.35, $.43 and $1.47, respectively.
(b) The summation of quarterly net income per share does not equate to the calculation for the full fiscal year as quarterly calculations are
performed on a discrete basis. (c) For the quarter ended March 31, 2002 and for the year ended June 30, 2002, a nonrecurring income tax
benefit (Note 11) increased reported net income per diluted share by $.04.
Regis Corporation
Stock Data
June 30, 2002
Regis common stock is listed and traded on the Nasdaq National Market under the symbol "RGIS."
The accompanying table sets forth the high and low closing bid quotations as reported by Nasdaq for each quarter during the previous two
fiscal years. The quotations reflect inter-dealer prices, without retail mark-up, mark-down or commission, and may not necessarily represent
actual transactions.
As of June 30, 2002, Regis shares were owned by approximately 27,476 shareholders. The common stock price was $24.48 per share on
August 27, 2002.
43
Quarter Ended
------------------------------------------------------------------------------------------------------------------------------------
(Dollars in thousands, except per share amounts) September 30 December 31 March 31 June 30 Year Ended
------------------------------------------------------------------------------------------------------------------------------------
2002(a)
Revenues .......................................... $349,668 $358,534 $361,578 $384,411 $1,454,191
Operating income .................................. 30,152 32,585 32,866 38,261 133,864
Net income ........................................ 15,356 16,967 19,334 20,397 72,054
Net income per diluted share(b)(c) ................ .36 .39 .44 .45 1.63
Dividends declared per share ...................... .03 .03 .03 .03 .12
Quarter Ended(a)
------------------------------------------------------------------------------------------------------------------------------------
(Dollars in thousands, except per share amounts) September 30 December 31 March 31 June 30 Year Ended
------------------------------------------------------------------------------------------------------------------------------------
2001
Revenues .......................................... $310,754 $324,049 $330,910 $345,908 $1,311,621
Operating income .................................. 25,761 25,435 26,375 31,710 109,281
Net income(a) ..................................... 12,715 12,087 12,533 15,753 53,088
Net income per diluted share(a)(b) ................ .31 .29 .30 .37 1.26
Dividends declared per share ...................... .03 .03 .03 .03 .12
-----------------------------------------------------------------------------
2002 2001
----------------- ----------------
High Low High Low
-----------------------------------------------------------------------------
1st Quarter ..................... $21.24 $17.77 $15.72 $12.41
2nd Quarter ..................... 27.94 20.23 16.32 13.14
3rd Quarter ..................... 28.30 24.59 15.73 13.20
4th Quarter ..................... 30.46 25.82 20.99 13.92


