Supercuts 2002 Annual Report Download - page 159
Download and view the complete annual report
Please find page 159 of the 2002 Supercuts annual report below. You can navigate through the pages in the report by either clicking on the pages listed below, or by using the keyword search tool below to find specific information within the annual report.-
 1
1 -
2
-
3
-
4
-
5
-
6
-
7
-
8
-
9
-
10
-
11
-
12
-
13
-
14
-
15
-
16
-
17
-
18
-
19
-
20
-
21
-
22
-
23
-
24
-
25
-
26
-
27
-
28
-
29
-
30
-
31
-
32
-
33
-
34
-
35
-
36
-
37
-
38
-
39
-
40
-
41
-
42
-
43
-
44
-
45
-
46
-
47
-
48
-
49
-
50
-
51
-
52
-
53
-
54
-
55
-
56
-
57
-
58
-
59
-
60
-
61
-
62
-
63
-
64
-
65
-
66
-
67
-
68
-
69
-
70
-
71
-
72
-
73
-
74
-
75
-
76
-
77
-
78
-
79
-
80
-
81
-
82
-
83
-
84
-
85
-
86
-
87
-
88
-
89
-
90
-
91
-
92
-
93
-
94
-
95
-
96
-
97
-
98
-
99
-
100
-
101
-
102
-
103
-
104
-
105
-
106
-
107
-
108
-
109
-
110
-
111
-
112
-
113
-
114
-
115
-
116
-
117
-
118
-
119
-
120
-
121
-
122
-
123
-
124
-
125
-
126
-
127
-
128
-
129
-
130
-
131
-
132
-
133
-
134
-
135
-
136
-
137
-
138
-
139
-
140
-
141
-
142
-
143
-
144
-
145
-
146
-
147
-
148
-
 149
149 -
 150
150 -
 151
151 -
 152
152 -
 153
153 -
 154
154 -
 155
155 -
 156
156 -
 157
157 -
 158
158 -
 159
159 -
 160
160 -
 161
161 -
 162
162 -
 163
163 -
 164
164 -
 165
165 -
 166
166 -
 167
167 -
 168
168 -
 169
169 -
170
-
171
-
172
-
173
-
174
-
175
-
176
-
177
 |
 |
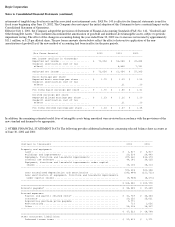
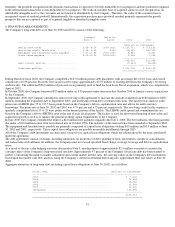
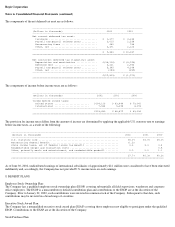
Certain intangible asset amounts set forth above are based on preliminary purchase price allocations associated with recent business
acquisitions, and are subject to finalization and adjustment.
All intangible assets have been assigned an estimated finite useful life, and are amortized on a straight-line basis over the number of years that
approximate their respective useful lives (ranging from four to 30 years). The straight-line method of amortization allocates the cost of the
intangible assets to earnings in proportion to the amount of economic benefits obtained by the Company in that reporting period. Total
amortization expense related to other intangible assets during the years ended June 30 2002, 2001 and 2000 was approximately $2.3 million,
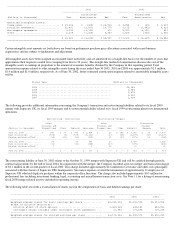
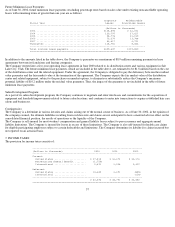
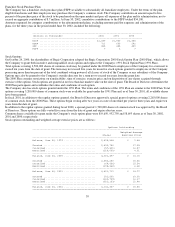
$1.4 million and $1.0 million, respectively. As of June 30, 2002, future estimated amortization expense related to amortizable intangible assets
will be:
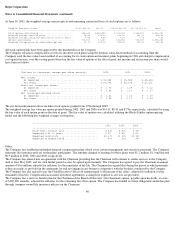
The following provides additional information concerning the Company's transaction and restructuring liabilities related to its fiscal 2000
merger with Supercuts UK, its fiscal 1999 mergers and its restructuring liability related to its fiscal 1999 restructuring plan for its international
operations.
The restructuring liability at June 30, 2002 relates to the October 31, 1999 merger with Supercuts UK and will be satisfied through periodic
contractual payments by the end of fiscal 2004. In conjunction with the merger, the Company recorded a pre-tax merger and transaction charge
of $3.1 million in the second quarter of fiscal 2000. This charge included approximately $2.6 million for severance and other costs principally
associated with the closure of Supercuts UK's headquarters. Severance expense covered the termination of approximately 11 employees of
Supercuts UK who had duplicate positions within the corporate office functions. The charge also included approximately $0.5 million for
professional fees including investment banking, legal, accounting and miscellaneous transaction costs. See Note 11 for a listing of nonrecurring
fiscal 2000 merger related activity included in operating income.
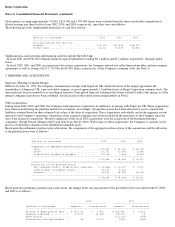
The following table sets forth a reconciliation of shares used in the computation of basic and diluted earnings per share:
---------------------------------------------------------------------------------------------------------------------
2002 2001
------------------------------------ ------------------------------------
Accumulated Accumulated
(Dollars in thousands) Cost Amortization Net Cost Amortization Net
---------------------------------------------------------------------------------------------------------------------
Amortized intangible assets:
Trade names .......................... $ 29,343 $ (425) $ 28,918 $ 3,854 $ (35) $ 3,819
Franchise agreements ................. 22,831 (2,061) 20,770 6,115 (1,482) 4,633
Non-compete agreements ............... 5,132 (4,760) 372 5,029 (4,192) 837
Other ................................ 6,275 (1,428) 4,847 2,525 (960) 1,565
---------------------------------------------------------------------------------------------------------------------
$ 63,581 $ (8,674) $ 54,907 $ 17,523 $ (6,669) $ 10,854
=====================================================================================================================
Fiscal Year (Dollars in thousands)
--------------------------------------------------------------------------------
2003 .................................................... $3,183
2004 .................................................... 2,948
2005 .................................................... 2,678
2006 .................................................... 2,634
2007 .................................................... 2,634
Restructuring--International Restructuring--Mergers
-------------------------------------------------------------------------------
Salon Salon Transaction
Closures and Closures and Charges--
(Dollars in thousands) Dispositions Other Subtotal Severance Dispositions Other Subtotal Mergers Total
------------------------------------------------------------------------------------------------------------------------------------
June 30, 2000 ............. $ 583 $ 67 $ 650 $ 2,824 $ 23 $ 145 $ 2,992 $ 35 $ 3,677
Cash utilization .......... (534) (5) (539) (1,616) (27) (48) (1,691) (47) (2,277)
Foreign currency effect ... (19) (62) (81) (209) 31 (97) (275) 12 (344)
------------------------------------------------------------------------------------------------------------------------------------
June 30, 2001 ............. 30 30 999 27 1,026 1,056
Cash utilization .......... (31) (31) (348) (27) (375) (406)
Foreign currency effect ... 1 1 62 62 63
------------------------------------------------------------------------------------------------------------------------------------
June 30, 2002 ............. $ -- $ -- $ -- $ 713 $ -- $ -- $ 713 $ -- $ 713
====================================================================================================================================
----------------------------------------------------------------------------------------------------------------
2002 2001 2000
----------------------------------------------------------------------------------------------------------------
Weighted average shares for basic earnings per share .............. 42,283,308 41,220,925 40,611,928
Effect of dilutive securities:
Dilutive effect of stock options ................................ 1,867,038 638,153 880,056
Contingent shares issuable under contingent stock agreements .... 21,986 171,895 110,298
----------------------------------------------------------------------------------------------------------------
Weighted average shares for diluted earnings per share ............ 44,172,332 42,030,973 41,602,282
================================================================================================================