Supercuts 2002 Annual Report Download - page 169
Download and view the complete annual report
Please find page 169 of the 2002 Supercuts annual report below. You can navigate through the pages in the report by either clicking on the pages listed below, or by using the keyword search tool below to find specific information within the annual report.Regis Corporation
Notes to Consolidated Financial Statements (continued)
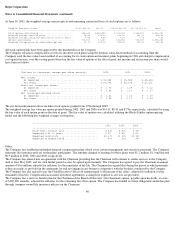
At June 30, 2002, the weighted average exercise prices and remaining contractual lives of stock options are as follows:
All stock option plans have been approved by the shareholders of the Company.
The Company measures compensation cost for its incentive stock plans using the intrinsic value-based method of accounting. Had the
Company used the fair-value-based method of accounting for its stock option and incentive plans beginning in 1996 and charged compensation
cost against income, over the vesting period based on the fair value of options at the date of grant, net income and net income per share would
have been as follows:
The pro forma information above includes stock options granted from 1996 through 2002.
The weighted average fair value per option granted during 2002, 2001 and 2000 was $14.31, $8.43 and $7.86, respectively, calculated by using
the fair value of each option grant on the date of grant. The fair value of options was calculated utilizing the Black-Scholes option-pricing
model and the following key weighted average assumptions:
Other:
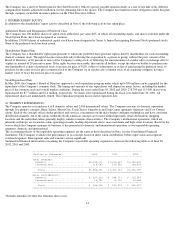
The Company has established unfunded deferred compensation plans which cover certain management and executive personnel. The Company
maintains life insurance policies on the plans' participants. The amounts charged to earnings for these plans were $1.2 million, $1.0 million and
$0.9 million in 2002, 2001 and 2000, respectively.
The Company has entered into an agreement with the Chairman providing that the Chairman will continue to render services to the Company
until at least May 2007, and for such further period as may be agreed upon mutually. The Company has agreed to pay the Chairman an annual
amount of $0.6 million, adjusted for inflation, for the remainder of his life. The Chairman has agreed that during the period in which payments
to him are made, as provided in the agreement, he will not engage in any business competitive with the business conducted by the Company.
The Company has also agreed to pay the Chief Executive Officer an amount equal to 60 percent of his salary, adjusted for inflation, for the
remainder of his life. Compensation associated with these agreements is charged to expense as services are provided.
The Company has a survivor benefit plan for the Chairman of the Board of Directors' (the Chairman) spouse, payable upon his death, at a rate
of $300,000 annually, adjusted for inflation, for the remaining life of his spouse. The Company has funded its future obligations under this plan
through company-owned life insurance policies on the Chairman.
40
Range of Exercise Prices $2.66-$15.00 $15.13 $15.15-$16.50 $17.00-$29.60 Total
------------------------------------------------------------------------------------------------------------------------------------
Total options outstanding ........................... 948,644 2,086,500 1,722,350 1,383,813 6,141,307
Weighted average exercise price ...................... $8.46 $15.13 $16.41 $21.32 $15.85
Weighted average remaining contractual life in years.. 3.40 8.08 7.39 7.63 7.06
Options exercisable .................................. 733,242 11,433 142,850 508,723 1,396,248
Weighted average price of exercisable options ........ $7.62 $15.13 $15.49 $18.52 $12.46
-------------------------------------------------------------------------------------------------
(Dollars in thousands, except per share amounts) 2002 2001 2000
-------------------------------------------------------------------------------------------------
Net income:
As reported .......................................... $ 72,054 $ 53,088 $ 49,654
Pro forma ............................................ $ 67,796 $ 49,178 $ 47,371
Basic net income per share:
As reported .......................................... $ 1.70 $ 1.29 $ 1.22
Pro forma ............................................ $ 1.60 $ 1.19 $ 1.17
Net income per diluted share:
As reported .......................................... $ 1.63 $ 1.26 $ 1.19
Pro forma ............................................ $ 1.53 $ 1.17 $ 1.14
--------------------------------------------------------------------------------
2002 2001 2000
--------------------------------------------------------------------------------
Risk-free interest rate ....................... 4.86% 5.80% 6.33%
Expected life in years ........................ 6.50 6.55 6.00
Expected volatility ........................... 43.27% 41.08% 39.34%
Expected dividend yield ....................... .49% .83% .64%


