Supercuts 2002 Annual Report Download - page 145
Download and view the complete annual report
Please find page 145 of the 2002 Supercuts annual report below. You can navigate through the pages in the report by either clicking on the pages listed below, or by using the keyword search tool below to find specific information within the annual report.-
 1
1 -
2
-
3
-
4
-
5
-
6
-
7
-
8
-
9
-
10
-
11
-
12
-
13
-
14
-
15
-
16
-
17
-
18
-
19
-
20
-
21
-
22
-
23
-
24
-
25
-
26
-
27
-
28
-
29
-
30
-
31
-
32
-
33
-
34
-
35
-
36
-
37
-
38
-
39
-
40
-
41
-
42
-
43
-
44
-
45
-
46
-
47
-
48
-
49
-
50
-
51
-
52
-
53
-
54
-
55
-
56
-
57
-
58
-
59
-
60
-
61
-
62
-
63
-
64
-
65
-
66
-
67
-
68
-
69
-
70
-
71
-
72
-
73
-
74
-
75
-
76
-
77
-
78
-
79
-
80
-
81
-
82
-
83
-
84
-
85
-
86
-
87
-
88
-
89
-
90
-
91
-
92
-
93
-
94
-
95
-
96
-
97
-
98
-
99
-
100
-
101
-
102
-
103
-
104
-
105
-
106
-
107
-
108
-
109
-
110
-
111
-
112
-
113
-
114
-
115
-
116
-
117
-
118
-
119
-
120
-
121
-
122
-
123
-
124
-
125
-
126
-
127
-
128
-
129
-
130
-
131
-
132
-
133
-
134
-
 135
135 -
 136
136 -
 137
137 -
 138
138 -
 139
139 -
 140
140 -
 141
141 -
 142
142 -
 143
143 -
 144
144 -
 145
145 -
 146
146 -
 147
147 -
 148
148 -
 149
149 -
 150
150 -
 151
151 -
 152
152 -
 153
153 -
 154
154 -
 155
155 -
156
-
157
-
158
-
159
-
160
-
161
-
162
-
163
-
164
-
165
-
166
-
167
-
168
-
169
-
170
-
171
-
172
-
173
-
174
-
175
-
176
-
177
 |
 |
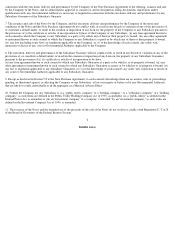
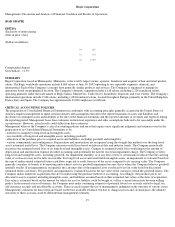
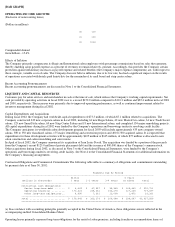
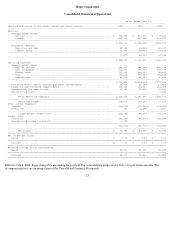
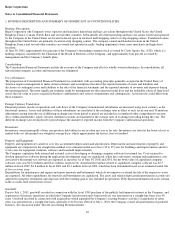
[BAR GRAPH]
GROSS MARGINS
basis points to 43.0 percent in fiscal 2001. The fiscal 2002 improvement was primarily due to improved payroll and payroll related costs as
compared to fiscal 2001. During fiscal 2001, payroll and payroll related costs were slightly higher than normal as a percentage of company-
owned revenues due to certain fixed cost payroll components increasing in greater magnitude than the related increase in sales. This resulted in
a lower gross margin due to a higher fixed payroll cost-to-sales ratio and caused the 30 basis point decline as a percentage of company-owned
revenues during fiscal 2001.
Product margins for fiscal 2002, as a percent of company-owned revenues, improved to 47.6 percent, compared to 47.0 percent in fiscal 2001
and 46.1 percent in fiscal 2000. The fiscal 2002 and 2001 improvements were primarily the result of a shift in the Company's mix of products
sold. Beginning in the latter portion of fiscal 2001, the product mix changed to consist more heavily of products with a higher profit margin.
Additionally, the fiscal 2002 improvement was driven by improved purchasing power, enabling the Company to buy retail product from
vendors at lower prices.
Direct Salon
This expense category includes direct costs associated with salon operations such as salon advertising, insurance, telephone, utilities and
janitorial costs. Direct salon expenses were $123.9 million in fiscal 2002, compared to $112.7 million and $92.8 million in fiscal 2001 and
2000, respectively, and remained consistent as a percent of company-owned revenue at 9.0 percent in fiscal 2002 and 2001, compared to 8.5
percent in fiscal 2000. During fiscal 2002, higher workers' compensation costs were offset by lower advertising costs on a per salon basis and
same-
store sales increasing at a rate faster than certain fixed cost components. The fiscal 2001 costs increased as a percentage of sales primarily
due to higher utility and freight costs, increased workers' compensation rates and lower same-store sales increases.
Rent
Rent expense in fiscal 2002 was $197.3 million, compared to $176.9 million and $152.7 million in fiscal 2001 and 2000, respectively. Rent
expense increased 20 basis points to 14.3 percent of company-owned revenues during fiscal 2002 primarily due to higher common area
maintenance costs. In regional malls, landlords experienced higher maintenance, insurance and security costs which they are passing on to their
tenants such as Regis. In fiscal 2001, rent expense increased ten basis points to 14.1 percent of company-owned revenue primarily due to lower
same-store sales increases over which to spread this relatively fixed cost.
Depreciation--Salon Level
Depreciation expense at the salon level remained relatively consistent at 3.5 percent of company-owned revenue in fiscal 2002, compared to
3.4 percent in fiscal 2001 and 2000.
Direct Salon Contribution
For reasons previously discussed, direct salon contribution, representing company-owned salon revenues less associated operating expenses,
improved in fiscal 2002 to $244.8 million, or 17.8 percent of company-owned revenues, compared to $222.2 million, or 17.7 percent, in fiscal
2001 and $199.4 million, or 18.2 percent, in fiscal 2000.
Franchise Direct Costs, Including Product and Equipment Franchise direct costs include all direct costs related to franchise salons, such as the
cost of products and equipment sold to franchisees and direct costs incurred at the Home Office and in Europe to support franchising activities.
Franchise direct costs increased to $38.1 million, or 49.1 percent of franchise revenue, during fiscal 2002. The increase was primarily related to
costs associated with the recently acquired European franchise companies, GGG and JLD. Additionally, growth in the sale of retail product to
franchisees contributed to the fiscal 2002 increase. During fiscal 2001, franchise direct costs increased $3.8 million to $21.2 million,
representing a 300 basis point increase to 37.7 percent of franchise revenue. The fiscal 2001 increase was due to acquisitions of two Canadian
franchise companies in the second and third quarters of fiscal 2001.
Corporate and Franchise Support Costs
Corporate and franchise support costs include expenses related to field supervision (payroll, related taxes and travel) and home office
administration costs (such as warehousing, salaries, occupancy costs and professional fees). Corporate and franchise support costs increased
$13.7 million in fiscal 2002 to $139.7 million. As a percent of total revenue, corporate and franchise support costs during fiscal 2002 remained
consistent at 9.6 percent. During fiscal 2001, corporate and franchise support costs increased $10.9 million from $115.1 million in fiscal 2000
and decreased 50 basis points as a percent of sales from 10.1 percent. The 50 basis point improvement for fiscal 2001 was primarily due to
fiscal 2000 results including costs incurred related to the introduction of the new Regis retail product line as well as costs related to the
Company's transition of the Supercuts UK home office.
21
00 44.1%
01 44.2%
02 44.6%