Supercuts 2002 Annual Report Download - page 152
Download and view the complete annual report
Please find page 152 of the 2002 Supercuts annual report below. You can navigate through the pages in the report by either clicking on the pages listed below, or by using the keyword search tool below to find specific information within the annual report.-
 1
1 -
2
-
3
-
4
-
5
-
6
-
7
-
8
-
9
-
10
-
11
-
12
-
13
-
14
-
15
-
16
-
17
-
18
-
19
-
20
-
21
-
22
-
23
-
24
-
25
-
26
-
27
-
28
-
29
-
30
-
31
-
32
-
33
-
34
-
35
-
36
-
37
-
38
-
39
-
40
-
41
-
42
-
43
-
44
-
45
-
46
-
47
-
48
-
49
-
50
-
51
-
52
-
53
-
54
-
55
-
56
-
57
-
58
-
59
-
60
-
61
-
62
-
63
-
64
-
65
-
66
-
67
-
68
-
69
-
70
-
71
-
72
-
73
-
74
-
75
-
76
-
77
-
78
-
79
-
80
-
81
-
82
-
83
-
84
-
85
-
86
-
87
-
88
-
89
-
90
-
91
-
92
-
93
-
94
-
95
-
96
-
97
-
98
-
99
-
100
-
101
-
102
-
103
-
104
-
105
-
106
-
107
-
108
-
109
-
110
-
111
-
112
-
113
-
114
-
115
-
116
-
117
-
118
-
119
-
120
-
121
-
122
-
123
-
124
-
125
-
126
-
127
-
128
-
129
-
130
-
131
-
132
-
133
-
134
-
135
-
136
-
137
-
138
-
139
-
140
-
141
-
 142
142 -
 143
143 -
 144
144 -
 145
145 -
 146
146 -
 147
147 -
 148
148 -
 149
149 -
 150
150 -
 151
151 -
 152
152 -
 153
153 -
 154
154 -
 155
155 -
 156
156 -
 157
157 -
 158
158 -
 159
159 -
 160
160 -
 161
161 -
 162
162 -
163
-
164
-
165
-
166
-
167
-
168
-
169
-
170
-
171
-
172
-
173
-
174
-
175
-
176
-
177
 |
 |
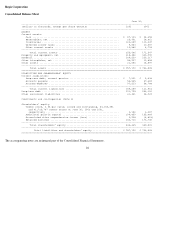
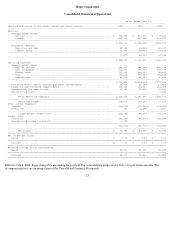
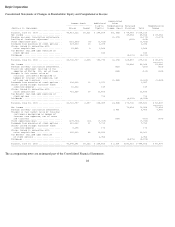
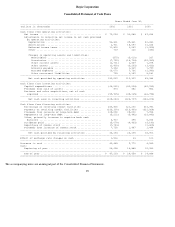
Regis Corporation
Consolidated Statement of Operations
Effective July 1, 2001, Regis changed its accounting for goodwill. For comparability purposes, see Note 1 for pro forma amounts. The
accompanying notes are an integral part of the Consolidated Financial Statements.
27
Years Ended June 30,
---------------------------------------------------------------------------------------------------------------------------
(Dollars and shares in thousands, except per share amounts) 2002 2001 2000
---------------------------------------------------------------------------------------------------------------------------
Revenues:
Company-owned salons:
Service ................................................................. $ 963,884 $ 893,472 $ 779,604
Product ................................................................. 412,728 361,858 313,125
---------------------------------------------------------------------------------------------------------------------------
1,376,612 1,255,330 1,092,729
Franchise revenues:
Royalties and fees ...................................................... 50,745 38,230 36,157
Product sales ........................................................... 26,834 18,061 14,107
---------------------------------------------------------------------------------------------------------------------------
77,579 56,291 50,264
---------------------------------------------------------------------------------------------------------------------------
1,454,191 1,311,621 1,142,993
Operating expenses:
Company-owned salons:
Cost of service ......................................................... 546,027 508,981 442,198
Cost of product ......................................................... 216,373 191,796 168,787
Direct salon ............................................................ 123,915 112,667 92,841
Rent .................................................................... 197,269 176,947 152,685
Depreciation ............................................................ 48,269 42,720 36,832
---------------------------------------------------------------------------------------------------------------------------
1,131,853 1,033,111 893,343
Franchise direct costs, including product and equipment .................... 38,114 21,237 17,443
Corporate and franchise support costs ...................................... 139,654 125,927 115,058
Depreciation and amortization .............................................. 10,706 22,065 16,993
Nonrecurring items ......................................................... 2,940
---------------------------------------------------------------------------------------------------------------------------
Total operating expenses .............................................. 1,320,327 1,202,340 1,045,777
---------------------------------------------------------------------------------------------------------------------------
Operating income ...................................................... 133,864 109,281 97,216
Other income (expense):
Interest ................................................................... (19,010) (21,487) (15,839)
Other, net ................................................................. 796 1,085 1,857
---------------------------------------------------------------------------------------------------------------------------
Income before income taxes ............................................ 115,650 88,879 83,234
Income taxes:
Provision .................................................................. (45,346) (35,791) (33,580)
Nonrecurring income tax benefit ............................................ 1,750
---------------------------------------------------------------------------------------------------------------------------
(43,596) (35,791) (33,580)
---------------------------------------------------------------------------------------------------------------------------
Net income ............................................................ $ 72,054 $ 53,088 $ 49,654
===========================================================================================================================
Net income per share:
Basic ...................................................................... $ 1.70 $ 1.29 $ 1.22
===========================================================================================================================
Diluted .................................................................... $ 1.63 $ 1.26 $ 1.19
===========================================================================================================================
Weighted average shares outstanding:
Basic ...................................................................... 42,283 41,221 40,612
===========================================================================================================================
Diluted .................................................................... 44,172 42,031 41,602
===========================================================================================================================