Singapore Airlines 2001 Annual Report Download - page 65
Download and view the complete annual report
Please find page 65 of the 2001 Singapore Airlines annual report below. You can navigate through the pages in the report by either clicking on the pages listed below, or by using the keyword search tool below to find specific information within the annual report.-
 1
1 -
2
-
3
-
4
-
5
-
6
-
7
-
8
-
9
-
10
-
11
-
12
-
13
-
14
-
15
-
16
-
17
-
18
-
19
-
20
-
21
-
22
-
23
-
24
-
25
-
26
-
27
-
28
-
29
-
30
-
31
-
32
-
33
-
34
-
35
-
36
-
37
-
38
-
39
-
40
-
41
-
42
-
43
-
44
-
45
-
46
-
47
-
48
-
49
-
50
-
51
-
52
-
53
-
54
-
 55
55 -
 56
56 -
 57
57 -
 58
58 -
 59
59 -
 60
60 -
 61
61 -
 62
62 -
 63
63 -
 64
64 -
 65
65 -
 66
66 -
 67
67 -
 68
68 -
 69
69 -
 70
70 -
 71
71 -
 72
72 -
 73
73 -
 74
74 -
 75
75 -
76
-
77
-
78
-
79
-
80
-
81
-
82
-
83
-
84
-
85
-
86
-
87
-
88
-
89
-
90
-
91
-
92
-
93
-
94
-
95
-
96
-
97
-
98
-
99
-
100
-
101
-
102
-
103
-
104
-
105
-
106
-
107
-
108
-
109
-
110
 |
 |

63 SIA annual report 00/01
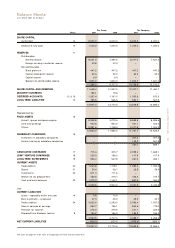
The Group The Company
Notes 2001 2000 2001 2000
SHARE CAPITAL
Authorised 10 6,000.0 6,000.0 6,000.0 6,000.0
Issued and fully paid 10 1,220.2 1,250.5 1,220.2 1,250.5
RESERVES 11
Distributable
General reserve 8,031.0 7,390.6 8,477.4 7,931.0
Foreign currency translation reserve 40.8 30.3 – –
Non-distributable
Share premium 447.2 447.2 447.2 447.2
Capital redemption reserve 62.3 32.0 62.3 32.0
Capital reserve 6.9 6.9 – –
Special non-distributable reserve 1,800.0 1,800.0 1,800.0 1,800.0
10,388.2 9,707.0 10,786.9 10,210.2
SHARE CAPITAL AND RESERVES 11,608.4 10,957.5 12,007.1 11,460.7
M INORITY INTERESTS 186.1 19.6 – –
DEFERRED ACCOUNTS 12 & 13 1,357.4 1,167.0 1,050.6 872.5
LONG-TERM LIABILITIES 14 795.5 566.5 592.1 561.8
13,947.4 12,710.6 13,649.8 12,895.0
Represented by:-
FIXED ASSETS 15
Aircraft, spares and spare engines 8,938.8 9,279.5 8,582.8 8,995.6
Land and buildings 942.6 854.0 401.1 423.0
Others 2,981.6 1,748.5 2,477.8 1,204.3
12,863.0 11,882.0 11,461.7 10,622.9
SUBSIDIARY COM PANIES 16
Investment in subsidiary companies – – 307.2 307.2
Amount owing by subsidiary companies – – 159.9 551.9
– – 467.1 859.1
ASSOCIATED COM PANIES 17 715.4 305.7 2,099.4 1,668.1
JOINT VENTURE COM PANIES 18 239.0 188.2 107.9 107.9
LONG-TERM INVESTM ENTS 19 556.0 537.8 467.3 463.1
CURRENT ASSETS
Trade debtors 20 1,244.8 1,178.1 1,082.4 1,054.2
Stocks 21 54.4 56.7 26.5 28.4
Investments 22 511.4 711.6 – –
Section 44 tax prepayments 455.6 415.7 455.6 415.7
Cash and bank balances 23 1,272.3 1,142.1 867.0 944.2
3,538.5 3,504.2 2,431.5 2,442.5
Less:
CURRENT LIABILITIES
Loans – repayable within one year 14 0.6 15.6 – –
Bank overdrafts – unsecured 27.4 49.2 25.9 43.7
Trade creditors 24 2,622.6 2,293.5 2,093.4 1,937.3
Sales in advance of carriage 853.7 786.1 840.5 775.0
Provision for taxation 276.0 376.6 241.1 326.3
Proposed final dividend, less tax 8 184.2 186.3 184.2 186.3
3,964.5 3,707.3 3,385.1 3,268.6
NET CURRENT LIABILITIES (426.0) (203.1) (953.6) (826.1)
13,947.4 12,710.6 13,649.8 12,895.0
The notes on pages 67 to 91 form an integral part of these financial statements.
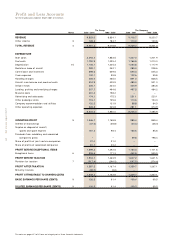
Balance Sheets
at 31 March 2001 (in $ million)