Singapore Airlines 2001 Annual Report Download - page 36
Download and view the complete annual report
Please find page 36 of the 2001 Singapore Airlines annual report below. You can navigate through the pages in the report by either clicking on the pages listed below, or by using the keyword search tool below to find specific information within the annual report.-
 1
1 -
2
-
3
-
4
-
5
-
6
-
7
-
8
-
9
-
10
-
11
-
12
-
13
-
14
-
15
-
16
-
17
-
18
-
19
-
20
-
21
-
22
-
23
-
24
-
25
-
 26
26 -
 27
27 -
 28
28 -
 29
29 -
 30
30 -
 31
31 -
 32
32 -
 33
33 -
 34
34 -
 35
35 -
 36
36 -
 37
37 -
 38
38 -
 39
39 -
 40
40 -
 41
41 -
 42
42 -
 43
43 -
 44
44 -
 45
45 -
 46
46 -
47
-
48
-
49
-
50
-
51
-
52
-
53
-
54
-
55
-
56
-
57
-
58
-
59
-
60
-
61
-
62
-
63
-
64
-
65
-
66
-
67
-
68
-
69
-
70
-
71
-
72
-
73
-
74
-
75
-
76
-
77
-
78
-
79
-
80
-
81
-
82
-
83
-
84
-
85
-
86
-
87
-
88
-
89
-
90
-
91
-
92
-
93
-
94
-
95
-
96
-
97
-
98
-
99
-
100
-
101
-
102
-
103
-
104
-
105
-
106
-
107
-
108
-
109
-
110
 |
 |
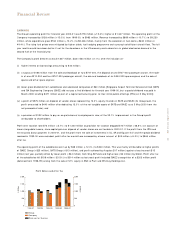
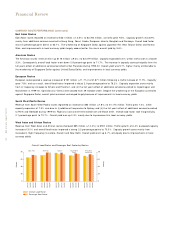
EARNINGS (continued)
The Group’s operating profit was $178 million (+15.2% ) higher at $1,347 million. Profit before tax rose $441 million (+30.1% ) to
$1,905 million. Share of profits of associated companies increased by $49 million (+146.1% ) to $82 million mainly because of the
contribution from Virgin Atlantic Limited (VAL). Profit attributable to shareholders at $1,549 million was $386 million higher (+33.1% ).
If the profit from the IPOs and the ex-gratia bonus payment in 2000-01, and the profit from the sale of investments in DL, SR and
Equant N.V. in 1999-00 were excluded, profit attributable to shareholders would have increased by a lower amount of $218 million
(+22.0% ) to $1,211 million after tax.
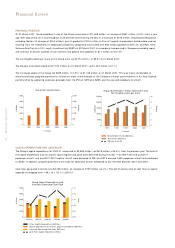
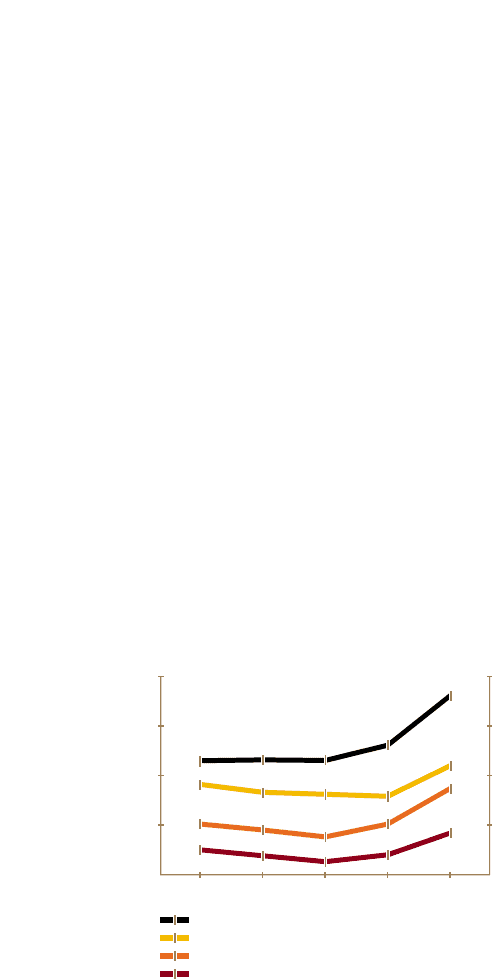
The Group’s basic earnings per share (based on 1,224.8 million shares representing the weighted average number of fully paid shares
in issue after accounting for the share buyback and cancellation of 30,334,600 shares since 1 April 2000) increased by 35.1 cents
(+38.4% ) to 126.5 cents. Dilution due to the first and second grants of share options to senior executives and all other employees of
the Company on 28 March 2000 and 3 July 2000 was insignificant, and the Group’s earnings per share was unchanged at 126.5 cents.
Return on turnover was 3.1 percentage points higher at 16.0% . Return on average shareholders’ funds improved 3.6 percentage points
to 13.7% , while return on total assets was 2.3 percentage points better than last year at 9.2% . If the profit from the IPOs and the
ex-gratia bonus payment in 2000-01, and the profit from the sale of investments in DL, SR and Equant N.V. in 1999-00 were excluded,
returns on turnover, average shareholders’ funds and total assets would be lowered to 12.5% , 11.0% , and 7.3% respectively.
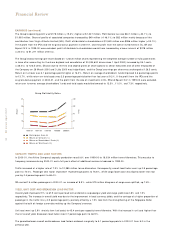
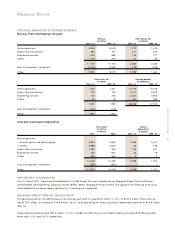
CAPACITY, TRAFFIC AND LOAD FACTORS
In 2000-01, the Airline Company’s capacity production rose 6.6% over 1999-00 to 18,034 million tonne-kilometres. This was due to
frequency increases during 2000-01 and a full year’s effect of additional services introduced in 1999-00.
Traffic increased at a higher rate of 7.9% to 12,985 million tonne-kilometres. Consequently, overall load factor went up 0.8 percentage
point to 72.0% . Passenger seat factor improved 1.9 percentage points to 76.8% , while cargo load factor was slightly lower than last
year by 0.4 percentage point to 68.4% .
SIA carried 15 million passengers in 2000-01, an increase of 8.9% , while 975 million kilograms of cargo were uplifted, up 7.8% .
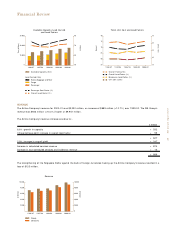
YIELD, UNIT COST AND BREAKEVEN LOAD FACTOR
Overall yield improved 2.9% to 67.9 cents per load tonne-kilometre as passenger yield and cargo yield rose 2.8% and 1.5%
respectively. The increase in overall yield was due to the improvement in local currency yields, and the carriage of a higher proportion of
passenger in the traffic mix (+0.5 percentage point), partially offset by a 1.9% loss from the strengthening of the Singapore Dollar
against the bulk of foreign currencies making up the Company’s revenue.
Unit cost went up 3.9% (mainly from fuel costs) to 45.4 cents per capacity tonne-kilometre. With the increase in unit cost higher than
that of overall yield, breakeven load factor rose 0.7 percentage point to 66.9% .
The spread between overall and breakeven load factors widened marginally to 5.1 percentage points in 2000-01 from 5.0 in the
previous year.
34 SIA annual report 00/01
Financial Review
25
20
15
10
5
140
105
70
35
0
Group Profitability Ratios
Cents
Percent
1996/97 1997/98 1998/99 1999/00 2000/01
Earnings per share (¢)
Return on Turnover (%)
Return on Shareholders’ Funds (%)
Return on Total Assets (%)