Singapore Airlines 2001 Annual Report Download - page 45
Download and view the complete annual report
Please find page 45 of the 2001 Singapore Airlines annual report below. You can navigate through the pages in the report by either clicking on the pages listed below, or by using the keyword search tool below to find specific information within the annual report.-
 1
1 -
2
-
3
-
4
-
5
-
6
-
7
-
8
-
9
-
10
-
11
-
12
-
13
-
14
-
15
-
16
-
17
-
18
-
19
-
20
-
21
-
22
-
23
-
24
-
25
-
26
-
27
-
28
-
29
-
30
-
31
-
32
-
33
-
34
-
 35
35 -
 36
36 -
 37
37 -
 38
38 -
 39
39 -
 40
40 -
 41
41 -
 42
42 -
 43
43 -
 44
44 -
 45
45 -
 46
46 -
 47
47 -
 48
48 -
 49
49 -
 50
50 -
 51
51 -
 52
52 -
 53
53 -
 54
54 -
 55
55 -
56
-
57
-
58
-
59
-
60
-
61
-
62
-
63
-
64
-
65
-
66
-
67
-
68
-
69
-
70
-
71
-
72
-
73
-
74
-
75
-
76
-
77
-
78
-
79
-
80
-
81
-
82
-
83
-
84
-
85
-
86
-
87
-
88
-
89
-
90
-
91
-
92
-
93
-
94
-
95
-
96
-
97
-
98
-
99
-
100
-
101
-
102
-
103
-
104
-
105
-
106
-
107
-
108
-
109
-
110
 |
 |

43 SIA annual report 00/01
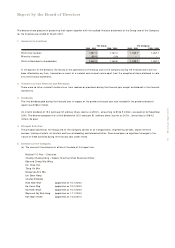
Financial Review
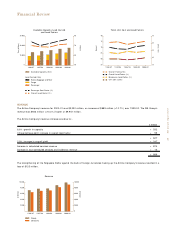
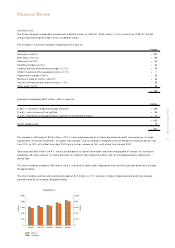
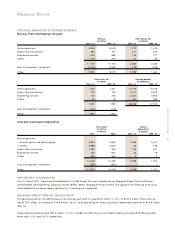
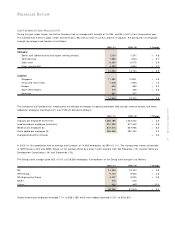
STATISTICAL BREAKDOWN BY BUSINESS SEGM ENTS
Revenue, Profit and Employee Strength
Revenue Profit Before Tax
($ million) ($ million)
2000 - 01 1999 - 00 2000 - 01 1999 - 00
Airline operations 9,408 8,518 1,713 1,679
Airport terminal services 892 794 211 200
Engineering services 674 588 129 317
Others 179 200 31 30
11,153 10,100 2,084 2,226
Less: Inter-segment transactions (1,202) (1,081) (179) (762)
Group 9,951 9,019 1,905 1,464
Profit After Tax Average Number
($ million) of Employees
2000 - 01 1999 - 00 2000 - 01 1999 - 00
Airline operations 1,434 1,301 14,730 14,196
Airport terminal services 175 160 9,147 8,923
Engineering services 116 306 4,037 3,925
Others 26 18 422 469
1,751 1,785 28,336 27,513
Less: Inter-segment transactions (164) (618)
Group 1,587 1,167
Total Assets and Capital Expenditure
Total Assets Capital
($ million) Expenditure
31 M arch ($ million)
2001 2000 2000 - 01 1999 - 00
Airline operations
– Aircraft, spares and spare engines 8,940 9,283 2,354 1,617
– Others 6,886 5,665 84 108
Airport terminal services 1,255 855 126 167
Engineering services 732 594 20 18
Others 355 362 5 2
18,168 16,759 2,589 1,912
Less: Inter-segment transactions (256) (341) – –
Group 17,912 16,418 2,589 1,912
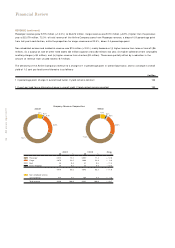
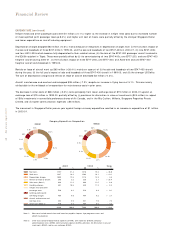
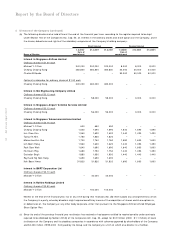
PERFORM ANCE OF SUBSIDIARIES
As at 31 March 2001, there were 25 subsidiaries in the SIA Group. The major subsidiaries are Singapore Airport Terminal Services
Limited (SATS), SIA Engineering Company Limited (SIAEC), SilkAir (Singapore) Private Limited. The figures in the following write-up on
these subsidiaries are shown before adjusting for inter-company transactions.
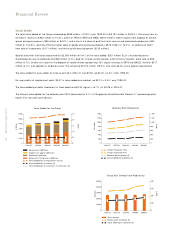
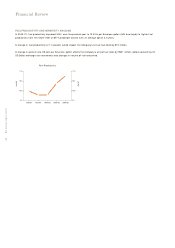
SINGAPORE AIRPORT TERM INAL SERVICES GROUP
The operating profit of the SATS Group for the financial year 2000-01 rose $13.2 million (+7.3% ) to $194.6 million. Profit after tax
was $175.0 million, an increase of $14.9 million (+9.3% ) after accounting for share of profits of associated companies of $14.8 million
after tax.
Group operating revenue grew $97.0 million (+12.3% ) to $887.2 million mainly from inflight catering and ground handling services
which rose 11.0% and 14.3% respectively.