Singapore Airlines 2001 Annual Report Download - page 38
Download and view the complete annual report
Please find page 38 of the 2001 Singapore Airlines annual report below. You can navigate through the pages in the report by either clicking on the pages listed below, or by using the keyword search tool below to find specific information within the annual report.-
 1
1 -
2
-
3
-
4
-
5
-
6
-
7
-
8
-
9
-
10
-
11
-
12
-
13
-
14
-
15
-
16
-
17
-
18
-
19
-
20
-
21
-
22
-
23
-
24
-
25
-
26
-
27
-
 28
28 -
 29
29 -
 30
30 -
 31
31 -
 32
32 -
 33
33 -
 34
34 -
 35
35 -
 36
36 -
 37
37 -
 38
38 -
 39
39 -
 40
40 -
 41
41 -
 42
42 -
 43
43 -
 44
44 -
 45
45 -
 46
46 -
 47
47 -
 48
48 -
49
-
50
-
51
-
52
-
53
-
54
-
55
-
56
-
57
-
58
-
59
-
60
-
61
-
62
-
63
-
64
-
65
-
66
-
67
-
68
-
69
-
70
-
71
-
72
-
73
-
74
-
75
-
76
-
77
-
78
-
79
-
80
-
81
-
82
-
83
-
84
-
85
-
86
-
87
-
88
-
89
-
90
-
91
-
92
-
93
-
94
-
95
-
96
-
97
-
98
-
99
-
100
-
101
-
102
-
103
-
104
-
105
-
106
-
107
-
108
-
109
-
110
 |
 |

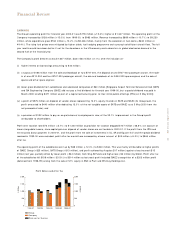
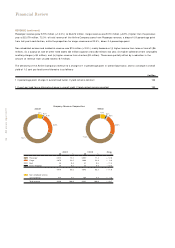
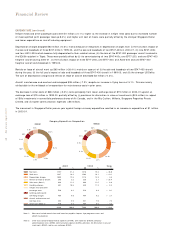
REVENUE (continued)
Passenger revenue grew $715 million (+12.0% ) to $6,672 million. Cargo revenue was $170 million (+8.9% ) higher than the previous
year at $2,079 million. 72.3% of total revenue of the Airline Company came from Passenger revenue, a drop of 0.9 percentage point
from last year’s contribution, while the proportion for cargo revenue was 22.5% , down 0.4 percentage point.
Non-scheduled services and incidental revenue rose $15 million (+3.5% ) mainly because of (i) higher income from lease of aircraft ($6
million), (ii) a surplus on sale of other fixed assets ($2 million) against a loss ($2 million) last year, (iii) higher collections from airwaybills
ancillary charges (+$4 million), and (iv) higher revenue from charters ($3 million). These were partially offset by a reduction in the
amount of revenue from unused tickets (-$7 million).
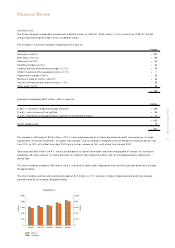
The sensitivity of the Airline Company’s revenue to a change of 1.0 percentage point in overall load factor, and to a change in overall
yield of 1.0 cent per load tonne-kilometre is as follows:-
$ million
1.0 percentage point change in overall load factor, if yield remains constant 123
1.0 cent per load tonne-kilometre change in overall yield, if load carried remains constant 130
36 SIA annual report 00/01
Financial Review
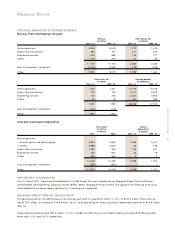
4.5% 0.3%
72.3%
0.4%
22.5%
2000/01
Company Revenue Composition
1999/00
4.8% 0.4%
71.4%
0.5%
22.9%
2000/ 01 1999/ 00 Change
$M % $M % %
■■■■ Passenger 6,672 72.3 5,957 71.4 + 12.0
■■■■ Cargo 2,079 22.5 1,909 22.9 + 8.9
■■■■ Mail 36 0.4 41 0.5 – 11.4
■■■■ Excess baggage 29 0.3 35 0.4 – 18.5
8,816 95.5 7,942 95.2 + 11.0
■■■■ Non-scheduled services
and incidental 414 4.5 399 4.8 + 3.5
Total revenue 9,230 100.0 8,341 100.0 + 10.7