Singapore Airlines 2001 Annual Report Download - page 43
Download and view the complete annual report
Please find page 43 of the 2001 Singapore Airlines annual report below. You can navigate through the pages in the report by either clicking on the pages listed below, or by using the keyword search tool below to find specific information within the annual report.-
 1
1 -
2
-
3
-
4
-
5
-
6
-
7
-
8
-
9
-
10
-
11
-
12
-
13
-
14
-
15
-
16
-
17
-
18
-
19
-
20
-
21
-
22
-
23
-
24
-
25
-
26
-
27
-
28
-
29
-
30
-
31
-
32
-
 33
33 -
 34
34 -
 35
35 -
 36
36 -
 37
37 -
 38
38 -
 39
39 -
 40
40 -
 41
41 -
 42
42 -
 43
43 -
 44
44 -
 45
45 -
 46
46 -
 47
47 -
 48
48 -
 49
49 -
 50
50 -
 51
51 -
 52
52 -
 53
53 -
54
-
55
-
56
-
57
-
58
-
59
-
60
-
61
-
62
-
63
-
64
-
65
-
66
-
67
-
68
-
69
-
70
-
71
-
72
-
73
-
74
-
75
-
76
-
77
-
78
-
79
-
80
-
81
-
82
-
83
-
84
-
85
-
86
-
87
-
88
-
89
-
90
-
91
-
92
-
93
-
94
-
95
-
96
-
97
-
98
-
99
-
100
-
101
-
102
-
103
-
104
-
105
-
106
-
107
-
108
-
109
-
110
 |
 |

41 SIA annual report 00/01
Financial Review
10,000
8,000
6,000
4,000
2,000
0
10,000
8,000
6,000
4,000
2,000
0
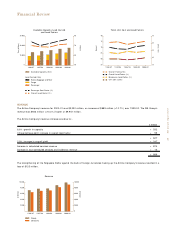
Company Revenue Composition by Routes
$ Million
$ Million
1999/00 2000/01
■■■■ West Asia and Africa
■■■■ South West Pacific
■■■■ Europe
■■■■ Americas
■■■■ East Asia
10.4%
13.7%
21.1%
23.9%
30.9%
10.3%
13.3%
21.2%
23.6%
31.6%
10,000
8,000
6,000
4,000
2,000
0
10,000
8,000
6,000
4,000
2,000
0
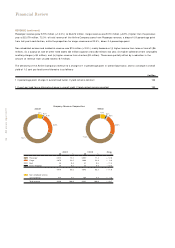
Company Revenue Composition
by Area of Original Sale
$ Million
$ Million
1999/00 2000/01
8.0%
9.6%
16.8%
9.6%
56.0%
7.9%
9.6%
17.0%
9.6%
55.9%
■■■■ West Asia and Africa
■■■■ South West Pacific
■■■■ Europe
■■■■ Americas
■■■■ East Asia
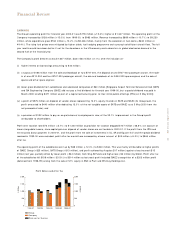
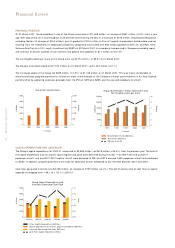
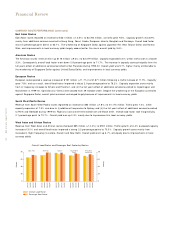
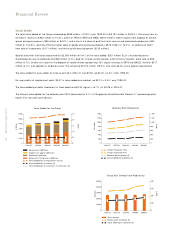
In terms of contribution by area of original sale, East Asian countries emerged the top contributor to systemwide revenue (55.9% ) for
2000-01, followed by countries in Europe (17.0% ), Americas (9.6% ), South West Pacific (9.6% ) and West Asia and Africa (7.9% ).
In 2000-01, revenue from East Asian routes contributed 31.6% , up 0.7 percentage point from 1999-00. Revenue from American
routes made up 23.6% , down 0.3 percentage point, while European routes’ share of revenue was slightly higher by 0.1 percentage
point at 21.2% . South West Pacific routes had a 13.3% share, down 0.4 percentage point, and the contribution from West Asian and
African routes was 10.3% , a marginal drop of 0.1 percentage point.
About three quarters of the Company's revenue collections in 2000-01 were mainly in Singapore Dollars, United States Dollars,
Japanese Yen, Australian Dollars, Sterling Pounds, Hong Kong Dollars, and Euro currencies.
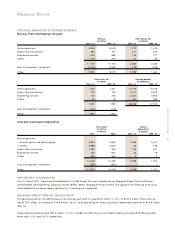
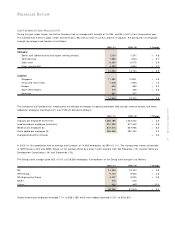
COM PANY ROUTE PERFORM ANCE
By Route Region
Revenue by Area
of Original Sale Revenue Overall Load Passenger
(Note 1) (Note 2) Factor Seat Factor
$ million $ million % %
2000 - 01 1999 - 00 2000 - 01 1999 - 00 2000 - 01 1999 - 00 2000 - 01 1999 - 00
East Asia 4,927 4,449 2,784 2,453 65.7 65.2 72.8 71.2
Americas 844 761 2,079 1,903 71.7 72.6 79.4 79.1
Europe 1,503 1,334 1,871 1,674 78.2 75.3 78.8 74.7
South West Pacific 842 766 1,175 1,090 70.7 70.6 77.0 75.6
West Asia and Africa 700 632 907 822 70.0 67.8 74.7 72.4
Systemwide 8,816 7,942 8,816 7,942 72.0 71.2 76.8 74.9
Non-scheduled services and
incidental revenue 414 399
9,230 8,341
Note 1
Revenue by area of original sale is defined as revenue originating in the area in which the sale is made. East Asia covers mainly Brunei, Hong Kong, Indonesia, Japan,
Korea, Macau, Malaysia, People’s Republic of China, Philippines, Singapore, Thailand and Taiwan. Americas comprises mainly Canada, Latin America and USA. Europe
consists mainly of Baltic States, Continental Europe, Russia, Scandinavia and United Kingdom. South West Pacific includes largely Australia and New Zealand. West Asia
and Africa are mainly made up of Bangladesh, India, M auritius, Middle East, Pakistan, South Africa and Turkey.
Note 2
Revenue by route region is defined as revenue derived from a route originating from Singapore with its final destination in countries covered by the region and vice
versa. For example, revenue from SIN-HKG-SFO-HKG-SIN route is classified under Americas region.