Singapore Airlines 2001 Annual Report Download - page 47
Download and view the complete annual report
Please find page 47 of the 2001 Singapore Airlines annual report below. You can navigate through the pages in the report by either clicking on the pages listed below, or by using the keyword search tool below to find specific information within the annual report.-
 1
1 -
2
-
3
-
4
-
5
-
6
-
7
-
8
-
9
-
10
-
11
-
12
-
13
-
14
-
15
-
16
-
17
-
18
-
19
-
20
-
21
-
22
-
23
-
24
-
25
-
26
-
27
-
28
-
29
-
30
-
31
-
32
-
33
-
34
-
35
-
36
-
 37
37 -
 38
38 -
 39
39 -
 40
40 -
 41
41 -
 42
42 -
 43
43 -
 44
44 -
 45
45 -
 46
46 -
 47
47 -
 48
48 -
 49
49 -
 50
50 -
 51
51 -
 52
52 -
 53
53 -
 54
54 -
 55
55 -
 56
56 -
 57
57 -
58
-
59
-
60
-
61
-
62
-
63
-
64
-
65
-
66
-
67
-
68
-
69
-
70
-
71
-
72
-
73
-
74
-
75
-
76
-
77
-
78
-
79
-
80
-
81
-
82
-
83
-
84
-
85
-
86
-
87
-
88
-
89
-
90
-
91
-
92
-
93
-
94
-
95
-
96
-
97
-
98
-
99
-
100
-
101
-
102
-
103
-
104
-
105
-
106
-
107
-
108
-
109
-
110
 |
 |

45 SIA annual report 00/01
Financial Review
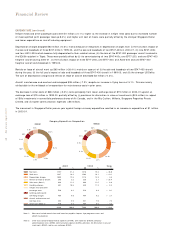
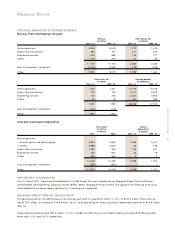
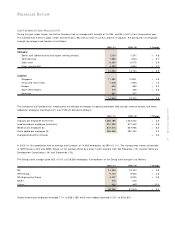
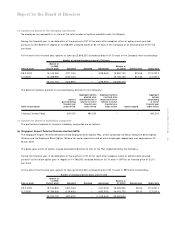
STATEM ENT OF VALUE ADDED AND ITS DISTRIBUTION (IN $ M ILLION)
2000 - 01 1999 - 00 1998 - 99 1997 - 98 1996 - 97
Total revenue 9,951.3 9,018.8 7,895.8 7,821.8 7,330.3
Less: Purchase of goods and services (5,366.1) (4,791.2) (4,060.6) (3,886.5) (3,696.6)
Value added by the Group 4,585.2 4,227.6 3,835.2 3,935.3 3,633.7
Add: Surplus on disposal of aircraft,
spares and spare engines 181.3 98.4 211.3 157.1 173.8
Share of profits of joint venture companies 27.0 21.0 13.9 7.1 1.9
Share of profits of associated companies 81.7 33.2 23.1 8.9 4.3
Profit on disposal of vendor shares
(13% equity interests in SATS and SIAEC) 440.1 ––––
Ex-gratia bonus payment (134.6) ––––
Profit on sale of investments – 171.3 – – –
Surplus on liquidation of Abacus
Distribution Systems – – 14.1 – –
Total value added available for distribution 5,180.7 4,551.5 4,097.6 4,108.4 3,813.7
Applied as follows:-
To employees
– Salaries and other staff costs 2,093.4 1,853.5 1,778.8 1,848.4 1,732.6
To government
– Corporation taxes 317.4 296.5 80.3 130.9 43.2
To suppliers of capital
– Dividends 321.1 295.5 240.6 213.6 284.8
– Interest on borrowings 37.5 28.8 29.5 28.2 24.5
– Minority interests 38.0 3.6 3.3 2.3 1.0
Retained for future capital requirements
– Depreciation 1,145.1 1,205.3 1,172.5 1,063.9 980.9
– Retained profit 1,228.2 868.3 792.6 821.1 746.7
Total value added 5,180.7 4,551.5 4,097.6 4,108.4 3,813.7
Value added per $ revenue ($) 0.52 0.50 0.52 0.53 0.52
Value added per $ employment cost ($) 2.47 2.46 2.30 2.22 2.20
Value added per $ investment in fixed assets ($) 0.28 0.24 0.23 0.24 0.23
Value added is a measure of wealth created. The statement above shows the Group’s value added from 1996-97 to 2000-01 and its distribution by way of payments to
employees, government, and to those who have provided capital. It also indicates the portion retained in the business for future capital requirements.