Singapore Airlines 2001 Annual Report Download - page 106
Download and view the complete annual report
Please find page 106 of the 2001 Singapore Airlines annual report below. You can navigate through the pages in the report by either clicking on the pages listed below, or by using the keyword search tool below to find specific information within the annual report.-
 1
1 -
2
-
3
-
4
-
5
-
6
-
7
-
8
-
9
-
10
-
11
-
12
-
13
-
14
-
15
-
16
-
17
-
18
-
19
-
20
-
21
-
22
-
23
-
24
-
25
-
26
-
27
-
28
-
29
-
30
-
31
-
32
-
33
-
34
-
35
-
36
-
37
-
38
-
39
-
40
-
41
-
42
-
43
-
44
-
45
-
46
-
47
-
48
-
49
-
50
-
51
-
52
-
53
-
54
-
55
-
56
-
57
-
58
-
59
-
60
-
61
-
62
-
63
-
64
-
65
-
66
-
67
-
68
-
69
-
70
-
71
-
72
-
73
-
74
-
75
-
76
-
77
-
78
-
79
-
80
-
81
-
82
-
83
-
84
-
85
-
86
-
87
-
88
-
89
-
90
-
91
-
92
-
93
-
94
-
95
-
 96
96 -
 97
97 -
 98
98 -
 99
99 -
 100
100 -
 101
101 -
 102
102 -
 103
103 -
 104
104 -
 105
105 -
 106
106 -
 107
107 -
 108
108 -
 109
109 -
 110
110
 |
 |

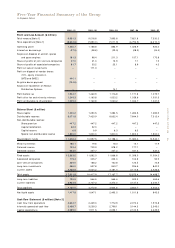
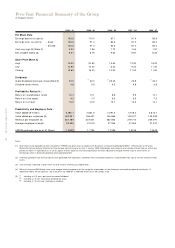
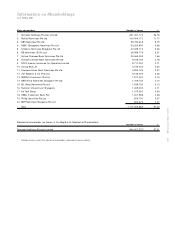
104 SIA annual report 00/01
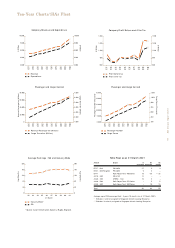
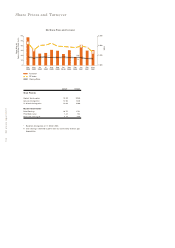
Share Prices and Turnover
60
50
40
30
20
10
0
2,500
2,000
1,500
1,000
SIA Share Prices and Turnover
Index
Share Price ($)
Volume (Million Stock Units)
Apr
2000 May
2000 Jun
2000 Jul
2000 Aug
2000 Sep
2000 Oct
2000 Nov
2000 Dec
2000 Jan
2001 Feb
2001 Mar
2001
■■■■ Turnover
ST Index
Closing Price
High
Low
2000-01 1999-00
Share Price ($)
Highest closing price 19.20 20.80
Lowest closing price 12.90 12.40
31 March closing price 13.60 16.00
M arket Value Ratios*
Price/Earnings 10.75 17.51
Price/Book value 1.43 1.83
Price/Cash earnings # 6.18 8.60
* Based on closing price on 31 March 2001.
# Cash earnings is defined as profit after tax and minority interests plus
depreciation.