Singapore Airlines 2001 Annual Report Download - page 48
Download and view the complete annual report
Please find page 48 of the 2001 Singapore Airlines annual report below. You can navigate through the pages in the report by either clicking on the pages listed below, or by using the keyword search tool below to find specific information within the annual report.
46 SIA annual report 00/01
Financial Review
VALUE ADDED
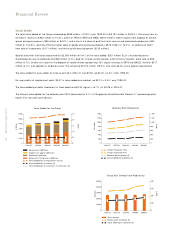
The total value added of the Group increased by $629 million (+13.8% ) over 1999-00 to $5,181 million in 2000-01. This came from an
increase in revenue (+$933 million or 10.3% ), profit on IPOs of SATS and SIAEC ($440 million), higher surplus from disposal of aircraft,
spares and spare engines (+$83 million or 84.2% ), and a rise in the share of profits of joint venture and associated companies (+$54
million or 100.6% ), partially offset by higher costs of goods and services purchased (+$575 million or 12.0% ), an absence of profit
from sale of investments (-$171 million), and the ex-gratia bonus payment ($135 million).
Salaries and other staff costs accounted for $2,093 million (40.4% ) of the value added. $321 million (6.2% ) was distributed to
shareholders by way of dividends and $38 million (0.7% ) paid for interest on borrowings, while minority interests’ share rose to $38
million (0.7% ) [mainly as a result of the disposal of vendor shares representing 13% equity interests in SATS and SIAEC]. Another $317
million (6.1% ) was applied on corporate taxes. The remaining $2,374 million (45.9% ) was retained for future capital requirements.
The value added for every dollar of revenue earned in 2000-01 was $0.52, up $0.02 (+4.0% ) from 1999-00.
For every dollar of employment costs, $2.47 in value added was created, up $0.01 (+0.4% ) over 1999-00.
The value added per dollar investment in fixed assets was $0.04 higher (+16.7% ) at $0.28 in 2000-01.
The Group’s value added for the calendar year 2000 accounted for 3.1% of Singapore’s Gross Domestic Product, 0.1 percentage point
higher than last year’s contribution.
6,000
5,000
4,000
3,000
2,000
1,000
0
2.5
2.0
1.5
1.0
0.5
0
Value Added for the Group
Dollars
$ Million
1996/97 1997/98 1998/99 1999/00 2000/01
■■■■ Government ($Million)
■■■■ Suppliers of Capital ($Million)
■■■■ Employees ($Million)
■■■■ Retained in the Business ($Million)
Value Added per $ employment cost ($)
Value Added per $ revenue ($)
Value Added per $ investment in fixed assets ($)
1,400
1,200
1,000
800
600
400
200
0
1,400
1,200
1,000
800
600
400
200
0
Company Staff Productivity
$’000
Tkm (000)
1996/97 1997/98 1998/99 1999/00 2000/01
Ctk per employee (tkm)
Ltk per employee (tkm)
Revenue per employee ($)
Value Added per employee ($)
50,000
40,000
30,000
20,000
10,000
0
400
300
200
100
0
Group Staff Strength and Productivity
$’000
Numbers
1996/97 1997/98 1998/99 1999/00 2000/01
■■■■ Staff strength
Revenue per employee ($)
Value Added per employee ($)


