Salesforce.com 2008 Annual Report Download - page 88
Download and view the complete annual report
Please find page 88 of the 2008 Salesforce.com annual report below. You can navigate through the pages in the report by either clicking on the pages listed below, or by using the keyword search tool below to find specific information within the annual report.-
 1
1 -
2
-
3
-
4
-
5
-
6
-
7
-
8
-
9
-
10
-
11
-
12
-
13
-
14
-
15
-
16
-
17
-
18
-
19
-
20
-
21
-
22
-
23
-
24
-
25
-
26
-
27
-
28
-
29
-
30
-
31
-
32
-
33
-
34
-
35
-
36
-
37
-
38
-
39
-
40
-
41
-
42
-
43
-
44
-
45
-
46
-
47
-
48
-
49
-
50
-
51
-
52
-
53
-
54
-
55
-
56
-
57
-
58
-
59
-
60
-
61
-
62
-
63
-
64
-
65
-
66
-
67
-
68
-
69
-
70
-
71
-
72
-
73
-
74
-
75
-
76
-
77
-
 78
78 -
 79
79 -
 80
80 -
 81
81 -
 82
82 -
 83
83 -
 84
84 -
 85
85 -
 86
86 -
 87
87 -
 88
88 -
 89
89 -
 90
90 -
 91
91 -
 92
92 -
 93
93 -
 94
94 -
 95
95 -
 96
96 -
 97
97 -
 98
98 -
99
-
100
-
101
-
102
-
103
-
104
-
105
-
106
-
107
-
108
-
109
-
110
-
111
-
112
-
113
-
114
-
115
-
116
-
117
-
118
-
119
-
120
-
121
-
122
-
123
-
124
-
125
-
126
-
127
-
128
-
129
-
130
-
131
-
132
-
133
-
134
-
135
-
136
-
137
-
138
-
139
-
140
-
141
-
142
-
143
-
144
-
145
-
146
-
147
-
148
-
149
-
150
 |
 |

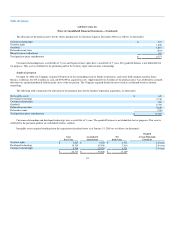
Table of Contents
salesforce.com, inc.
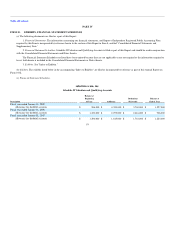
Notes to Consolidated Financial Statements—(Continued)
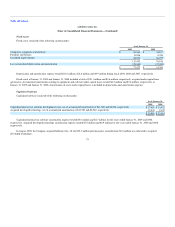
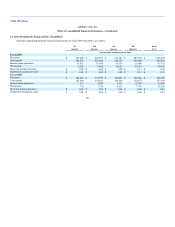
A reconciliation of income taxes at the statutory federal income tax rate to the provision for income taxes included in the accompanying consolidated
statements of operations is as follows (in thousands):
Fiscal Year Ended January 31,
2009 2008 2007
U.S. federal taxes at statutory rate $ 29,957 $ 16,175 $ 4,374
State, net of the federal benefit 4,685 2,916 1,146
Foreign losses providing no benefit 3,091 4,547 3,766
Foreign taxes in excess of the U.S. statutory rate 3,537 3,296 1,889
Tax credits (5,222) (3,817) (2,851)
Change in valuation allowance — (970) —
Non-deductible expenses 901 1,346 1,762
Other, net 608 (108) (291)
$ 37,557 $ 23,385 $ 9,795
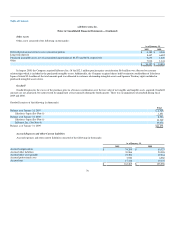
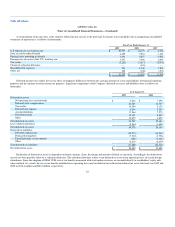
Deferred income taxes reflect the net tax effect of temporary differences between the carrying amounts of assets and liabilities for financial reporting
purposes and the amounts used for income tax purposes. Significant components of the Company's deferred tax assets and liabilities were as follows (in
thousands):
As of January 31,
2009 2008
Deferred tax assets:
Net operating loss carryforwards $ 6,212 $ 7,096
Deferred stock compensation 26,288 16,347
Tax credits 14,004 8,135
Deferred rent expense 6,244 5,530
Accrued liabilities 17,564 7,273
Deferred revenue 11,131 8,447
Other 10,479 6,825
Total deferred tax assets 91,922 59,653
Less valuation allowance (2,344) (1,650)
Total deferred tax assets 89,578 58,003
Deferred tax liabilities:
Deferred commissions (18,274) (16,562)
Purchased intangibles (7,912) (3,756)
Unrealized gains on investments (626) (1,321)
Other (4,277) (2,679)
Total deferred tax liabilities (31,089) (24,318)
Net deferred tax assets $ 58,489 $ 33,685
Realization of deferred tax assets is dependent on future earnings, if any, the timing and amount of which are uncertain. Accordingly, the deferred tax
assets have been partially offset by a valuation allowance. The valuation allowance relates to net deferred tax assets from operating losses of certain foreign
subsidiaries. Since the adoption of SFAS 123R, excess tax benefits associated with stock option exercises are recorded directly to stockholders' equity only
when realized. As a result, the excess tax benefits included in net operating loss carryforwards but not reflected in deferred tax assets for fiscal year 2009 and
2008 are $30.4 million and $60.2 million, respectively.
85