Salesforce.com 2008 Annual Report Download - page 51
Download and view the complete annual report
Please find page 51 of the 2008 Salesforce.com annual report below. You can navigate through the pages in the report by either clicking on the pages listed below, or by using the keyword search tool below to find specific information within the annual report.-
 1
1 -
2
-
3
-
4
-
5
-
6
-
7
-
8
-
9
-
10
-
11
-
12
-
13
-
14
-
15
-
16
-
17
-
18
-
19
-
20
-
21
-
22
-
23
-
24
-
25
-
26
-
27
-
28
-
29
-
30
-
31
-
32
-
33
-
34
-
35
-
36
-
37
-
38
-
39
-
40
-
 41
41 -
 42
42 -
 43
43 -
 44
44 -
 45
45 -
 46
46 -
 47
47 -
 48
48 -
 49
49 -
 50
50 -
 51
51 -
 52
52 -
 53
53 -
 54
54 -
 55
55 -
 56
56 -
 57
57 -
 58
58 -
 59
59 -
 60
60 -
 61
61 -
62
-
63
-
64
-
65
-
66
-
67
-
68
-
69
-
70
-
71
-
72
-
73
-
74
-
75
-
76
-
77
-
78
-
79
-
80
-
81
-
82
-
83
-
84
-
85
-
86
-
87
-
88
-
89
-
90
-
91
-
92
-
93
-
94
-
95
-
96
-
97
-
98
-
99
-
100
-
101
-
102
-
103
-
104
-
105
-
106
-
107
-
108
-
109
-
110
-
111
-
112
-
113
-
114
-
115
-
116
-
117
-
118
-
119
-
120
-
121
-
122
-
123
-
124
-
125
-
126
-
127
-
128
-
129
-
130
-
131
-
132
-
133
-
134
-
135
-
136
-
137
-
138
-
139
-
140
-
141
-
142
-
143
-
144
-
145
-
146
-
147
-
148
-
149
-
150
 |
 |

Table of Contents
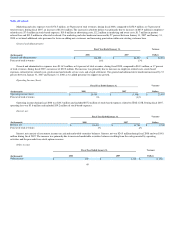
services and other revenues were $68.1 million, or 9 percent of total revenues, for fiscal 2008, compared to $45.4 million, or 9 percent of total revenues, for
fiscal 2007. The increase in professional services and other revenues was due primarily to the higher demand for services from an increased number of paying
subscriptions and customers.
Revenues in Europe and Asia Pacific accounted for $190.7 million, or 25 percent of total revenues, for fiscal 2008, compared to $109.5 million, or 22
percent of total revenues, during fiscal 2007, an increase of $81.2 million, or 74 percent. The increase in revenues outside of the Americas was the result of
our efforts to expand internationally.
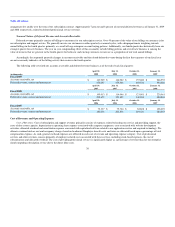
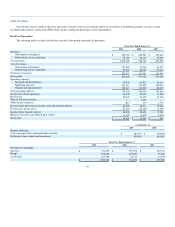
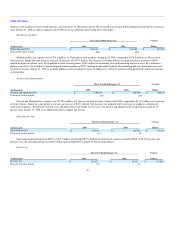
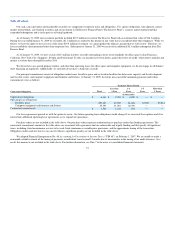
Cost of Revenues.
Fiscal Year Ended January 31, Variance
Dollars
(In thousands) 2008 2007
Subscription and support $ 91,268 $ 61,457 $ 29,811
Professional services and other 80,323 57,433 22,890
Total cost of revenues $ 171,591 $ 118,890 $ 52,701
Percent of total revenues 23% 24%
Cost of revenues was $171.6 million, or 23 percent of total revenues, during fiscal 2008, compared to $118.9 million, or 24 percent of total revenues,
during fiscal 2007, an increase of $52.7 million. The increase in absolute dollars was primarily due to an increase of $16.6 million in employee-related costs,
an increase of $2.4 million in stock-based expenses, an increase of $14.0 million in service delivery costs, primarily due to our efforts in increasing data center
capacity, an increase of $4.3 million in depreciation and amortization expenses, an increase of $10.2 million in outside subcontractor and other service costs
and an increase of $4.7 million in allocated overhead. The cost of the additional professional services headcount resulted in the cost of professional services
and other revenues to be in excess of the related revenue during fiscal 2008 by $12.2 million. We increased the professional services headcount in order to
meet the current and anticipated demand for our consulting and training services as our subscriber base has expanded to include more large businesses and as
we have expanded internationally.
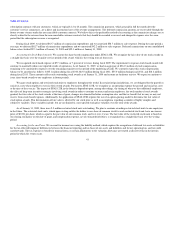
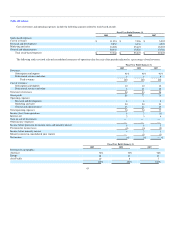
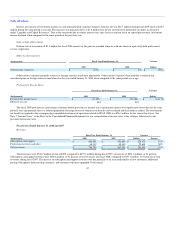
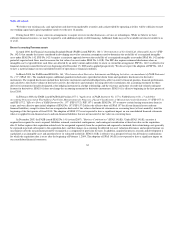
Research and Development.
Fiscal Year Ended January 31, Variance
Dollars
(In thousands) 2008 2007
Research and development $ 63,812 $ 44,614 $ 19,198
Percent of total revenues 8% 9%
Research and development expenses were $63.8 million, or 8 percent of total revenues, during fiscal 2008, compared to $44.6 million, or 9 percent of
total revenues, during fiscal 2007, an increase of $19.2 million. The increase in absolute dollars was due to an increase of $15.0 million in employee-related
costs, an increase of $1.8 million in stock-based expenses, and an increase of $2.4 million in allocated overhead. We increased our research and development
headcount by 32 percent between January 31, 2007 and January 31, 2008 in order to upgrade and extend our service offerings and develop new technologies.
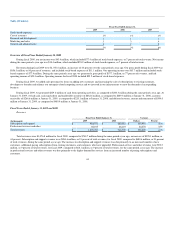
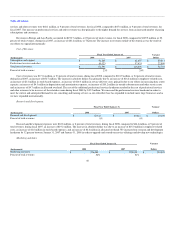
Marketing and Sales.
Fiscal Year Ended January 31, Variance
Dollars
(In thousands) 2008 2007
Marketing and sales $ 376,480 $ 252,935 $ 123,545
Percent of total revenues 50% 51%
48