Salesforce.com 2008 Annual Report Download - page 48
Download and view the complete annual report
Please find page 48 of the 2008 Salesforce.com annual report below. You can navigate through the pages in the report by either clicking on the pages listed below, or by using the keyword search tool below to find specific information within the annual report.-
 1
1 -
2
-
3
-
4
-
5
-
6
-
7
-
8
-
9
-
10
-
11
-
12
-
13
-
14
-
15
-
16
-
17
-
18
-
19
-
20
-
21
-
22
-
23
-
24
-
25
-
26
-
27
-
28
-
29
-
30
-
31
-
32
-
33
-
34
-
35
-
36
-
37
-
 38
38 -
 39
39 -
 40
40 -
 41
41 -
 42
42 -
 43
43 -
 44
44 -
 45
45 -
 46
46 -
 47
47 -
 48
48 -
 49
49 -
 50
50 -
 51
51 -
 52
52 -
 53
53 -
 54
54 -
 55
55 -
 56
56 -
 57
57 -
 58
58 -
59
-
60
-
61
-
62
-
63
-
64
-
65
-
66
-
67
-
68
-
69
-
70
-
71
-
72
-
73
-
74
-
75
-
76
-
77
-
78
-
79
-
80
-
81
-
82
-
83
-
84
-
85
-
86
-
87
-
88
-
89
-
90
-
91
-
92
-
93
-
94
-
95
-
96
-
97
-
98
-
99
-
100
-
101
-
102
-
103
-
104
-
105
-
106
-
107
-
108
-
109
-
110
-
111
-
112
-
113
-
114
-
115
-
116
-
117
-
118
-
119
-
120
-
121
-
122
-
123
-
124
-
125
-
126
-
127
-
128
-
129
-
130
-
131
-
132
-
133
-
134
-
135
-
136
-
137
-
138
-
139
-
140
-
141
-
142
-
143
-
144
-
145
-
146
-
147
-
148
-
149
-
150
 |
 |

Table of Contents
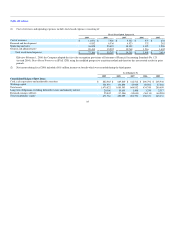
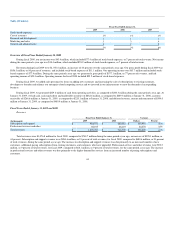
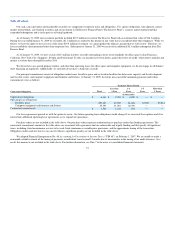
Revenues in Europe and Asia Pacific accounted for $300.3 million, or 28 percent of total revenues, for fiscal 2009, compared to $190.7 million, or 25
percent of total revenues, during the same period a year ago, an increase of $109.6 million, or 57 percent. The increase in revenues outside of the Americas
was the result of our efforts to expand internationally. Additionally, the value of the U.S. dollar relative to foreign currencies contributed to the increase in
total revenues for the year ended January 31, 2009 as compared the same period year ago. The foreign currency impact compared to the same period a year
ago was an increase of $6.6 million. As part of our overall growth, we expect the percentage of our revenue generated in Europe and Asia Pacific to continue
to increase as a larger percentage of our total revenues world wide.
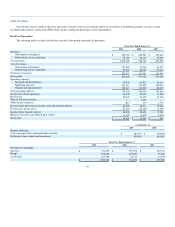
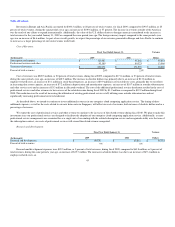
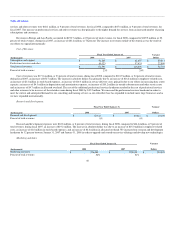
Cost of Revenues.
Fiscal Year Ended January 31, Variance
Dollars
(In thousands) 2009 2008
Subscription and support $ 127,082 $ 91,268 $ 35,814
Professional services and other 93,389 80,323 13,066
Total cost of revenues $ 220,471 $ 171,591 $ 48,880
Percent of total revenues 20% 23%
Cost of revenues was $220.5 million, or 20 percent of total revenues, during fiscal 2009, compared to $171.6 million, or 23 percent of total revenues,
during the same period a year ago, an increase of $48.9 million. The increase in absolute dollars was primarily due to an increase of $13.8 million in
employee-related costs, an increase of $3.1 million in stock-based expenses, an increase of $9.9 million in service delivery costs, primarily due to our efforts
in increasing data center capacity, an increase of $7.2 million in depreciation and amortization expenses, an increase of $10.7 million in outside subcontractor
and other service costs and an increase of $3.3 million in allocated overhead. The cost of the additional professional services headcount resulted in the cost of
professional services and other revenues to be in excess of the related revenue during fiscal 2009 by $1.2 million as compared to $12.2 million during fiscal
2008. This reduction was the result of increasing the utilization of existing professional services staff, utilizing more outside subcontractors and not
significantly increasing professional services headcount.
As described above, we intend to continue to invest additional resources in our enterprise cloud computing application service. The timing of these
additional expenses, as well as the costs related to our new data center in Singapore, will affect our cost of revenues, both in terms of absolute dollars and as a
percentage of revenues.
We expect the cost of professional services and other revenue to continue to be in excess of the related revenue during fiscal 2010. We plan to make this
investment since our professional services are designed to facilitate the adoption of our enterprise cloud computing application service. Additionally, as more
professional service arrangements are accounted for as a single unit of accounting with the related subscription service and recognized ratably over the term of
the subscription contract, our costs of professional services will exceed the related revenue recognized.
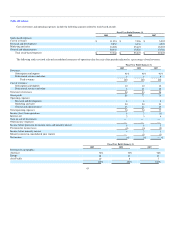
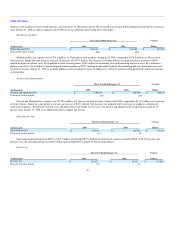
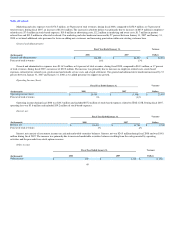
Research and Development.
Fiscal Year Ended January 31, Variance
Dollars
(In thousands) 2009 2008
Research and development $ 99,530 $ 63,812 $ 35,718
Percent of total revenues 9% 8%
Research and development expenses were $99.5 million, or 9 percent of total revenues, during fiscal 2009, compared to $63.8 million, or 8 percent of
total revenues, during the same period a year ago, an increase of $35.7 million. The increase in absolute dollars was due to an increase of $27.4 million in
employee-related costs, an
45