Salesforce.com 2008 Annual Report Download - page 45
Download and view the complete annual report
Please find page 45 of the 2008 Salesforce.com annual report below. You can navigate through the pages in the report by either clicking on the pages listed below, or by using the keyword search tool below to find specific information within the annual report.-
 1
1 -
2
-
3
-
4
-
5
-
6
-
7
-
8
-
9
-
10
-
11
-
12
-
13
-
14
-
15
-
16
-
17
-
18
-
19
-
20
-
21
-
22
-
23
-
24
-
25
-
26
-
27
-
28
-
29
-
30
-
31
-
32
-
33
-
34
-
 35
35 -
 36
36 -
 37
37 -
 38
38 -
 39
39 -
 40
40 -
 41
41 -
 42
42 -
 43
43 -
 44
44 -
 45
45 -
 46
46 -
 47
47 -
 48
48 -
 49
49 -
 50
50 -
 51
51 -
 52
52 -
 53
53 -
 54
54 -
 55
55 -
56
-
57
-
58
-
59
-
60
-
61
-
62
-
63
-
64
-
65
-
66
-
67
-
68
-
69
-
70
-
71
-
72
-
73
-
74
-
75
-
76
-
77
-
78
-
79
-
80
-
81
-
82
-
83
-
84
-
85
-
86
-
87
-
88
-
89
-
90
-
91
-
92
-
93
-
94
-
95
-
96
-
97
-
98
-
99
-
100
-
101
-
102
-
103
-
104
-
105
-
106
-
107
-
108
-
109
-
110
-
111
-
112
-
113
-
114
-
115
-
116
-
117
-
118
-
119
-
120
-
121
-
122
-
123
-
124
-
125
-
126
-
127
-
128
-
129
-
130
-
131
-
132
-
133
-
134
-
135
-
136
-
137
-
138
-
139
-
140
-
141
-
142
-
143
-
144
-
145
-
146
-
147
-
148
-
149
-
150
 |
 |

Table of Contents
Our effective tax rate could be adversely affected by changes in the mix of earnings and losses in countries with differing statutory tax rates, certain
non-deductible expenses arising from SFAS 123R and the valuation of deferred tax assets and liabilities.
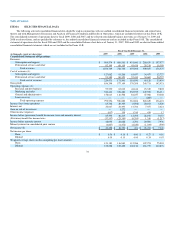
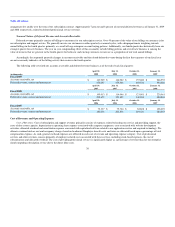
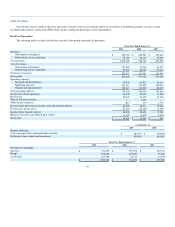
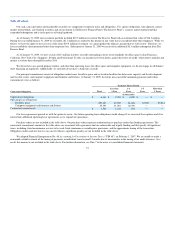
Results of Operations
The following tables set forth selected data for each of the periods indicated (in thousands).
Fiscal Year Ended January 31,
2009 2008 2007
Revenues:
Subscription and support $ 984,574 $ 680,581 $ 451,660
Professional services and other 92,195 68,119 45,438
Total revenues 1,076,769 748,700 497,098
Cost of revenues:
Subscription and support 127,082 91,268 61,457
Professional services and other 93,389 80,323 57,433
Total cost of revenues 220,471 171,591 118,890
Gross profit 856,298 577,109 378,208
Operating expenses:
Research and development 99,530 63,812 44,614
Marketing and sales 534,413 376,480 252,935
General and administrative 158,613 116,508 84,257
Total operating expenses 792,556 556,800 381,806
Income (loss) from operations 63,742 20,309 (3,598)
Interest, net 22,667 24,493 14,784
Gain on sale of investment — 1,272 —
Other income (expense) (817) 139 1,310
Income before provision for income taxes and minority interest 85,592 46,213 12,496
Provision for income taxes (37,557) (23,385) (9,795)
Income before minority interest 48,035 22,828 2,701
Minority interest in consolidated joint venture (4,607) (4,472) (2,220)
Net income $ 43,428 $ 18,356 $ 481
As of January 31,
2009 2008
Balance sheet data:
Cash, cash equivalents and marketable securities $ 882,565 $ 669,800
Deferred revenue, current and noncurrent 594,026 480,894
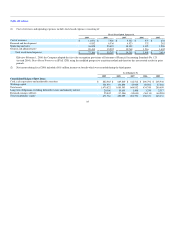
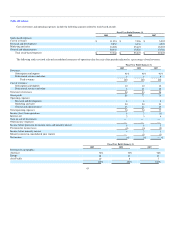
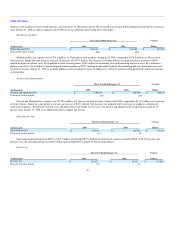
Fiscal Year Ended January 31,
2009 2008 2007
Revenues by geography:
Americas $ 776,495 $ 557,976 $ 387,570
Europe 190,685 127,010 75,026
Asia Pacific 109,589 63,714 34,502
$ 1,076,769 $ 748,700 $ 497,098
42