Salesforce.com 2008 Annual Report Download - page 47
Download and view the complete annual report
Please find page 47 of the 2008 Salesforce.com annual report below. You can navigate through the pages in the report by either clicking on the pages listed below, or by using the keyword search tool below to find specific information within the annual report.-
 1
1 -
2
-
3
-
4
-
5
-
6
-
7
-
8
-
9
-
10
-
11
-
12
-
13
-
14
-
15
-
16
-
17
-
18
-
19
-
20
-
21
-
22
-
23
-
24
-
25
-
26
-
27
-
28
-
29
-
30
-
31
-
32
-
33
-
34
-
35
-
36
-
 37
37 -
 38
38 -
 39
39 -
 40
40 -
 41
41 -
 42
42 -
 43
43 -
 44
44 -
 45
45 -
 46
46 -
 47
47 -
 48
48 -
 49
49 -
 50
50 -
 51
51 -
 52
52 -
 53
53 -
 54
54 -
 55
55 -
 56
56 -
 57
57 -
58
-
59
-
60
-
61
-
62
-
63
-
64
-
65
-
66
-
67
-
68
-
69
-
70
-
71
-
72
-
73
-
74
-
75
-
76
-
77
-
78
-
79
-
80
-
81
-
82
-
83
-
84
-
85
-
86
-
87
-
88
-
89
-
90
-
91
-
92
-
93
-
94
-
95
-
96
-
97
-
98
-
99
-
100
-
101
-
102
-
103
-
104
-
105
-
106
-
107
-
108
-
109
-
110
-
111
-
112
-
113
-
114
-
115
-
116
-
117
-
118
-
119
-
120
-
121
-
122
-
123
-
124
-
125
-
126
-
127
-
128
-
129
-
130
-
131
-
132
-
133
-
134
-
135
-
136
-
137
-
138
-
139
-
140
-
141
-
142
-
143
-
144
-
145
-
146
-
147
-
148
-
149
-
150
 |
 |

Table of Contents
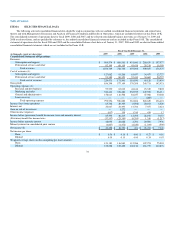
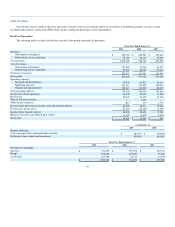
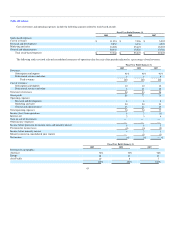
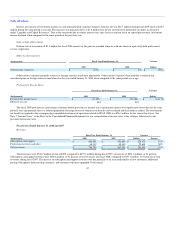
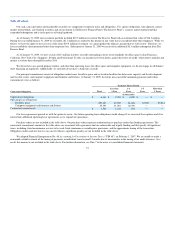
Fiscal Year Ended January 31,
2009 2008 2007
Stock-based expenses:
Cost of revenues 1% 1% 1%
Research and development 1 1 1
Marketing and sales 3 3 4
General and administrative 2 2 2
7% 7% 8%
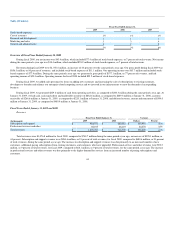
Overview of Fiscal Year Ended January 31, 2009
During fiscal 2009, our net income was $43.4 million, which included $77.4 million of stock-based expenses, or 7 percent of total revenue. Net income
during the same period a year ago was $18.4 million, which included $55.2 million of stock-based expenses, or 7 percent of total revenue.
Revenues during fiscal 2009 were $1,076.8 million, an increase of 44 percent over the same period a year ago. Our gross profit during fiscal 2009 was
$856.3 million, or 80 percent of revenues, and included stock-based expenses of $11.1 million. Our operating income was $63.7 million and included stock-
based expenses of $77.4 million. During the same period a year ago, we generated a gross profit of $577.1 million, or 77 percent of revenues, and had
operating income of $20.3 million. Operating income for fiscal 2008 included $55.2 million of stock-based expenses.
During fiscal 2009, we added sales personnel to focus on adding new customers and increasing the sale of subscriptions to existing customers,
developers to broaden and enhance our enterprise cloud computing service and we invested in our infrastructure to meet the demands of an expanding
business.
During fiscal 2009, we generated $229.6 million of cash from operating activities, as compared to $204.3 million during the same period a year ago. At
January 31, 2009, we had cash, cash equivalents and marketable securities of $882.6 million, as compared to $669.8 million at January 31, 2008, accounts
receivable of $266.6 million at January 31, 2009, as compared to $220.1 million at January 31, 2008, and deferred revenue, current and noncurrent of $594.0
million at January 31, 2009, as compared to $480.9 million at January 31, 2008.
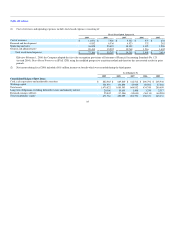
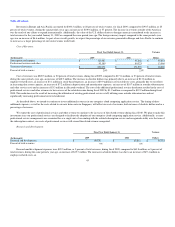
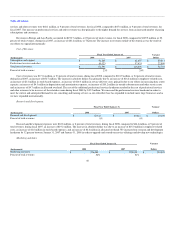
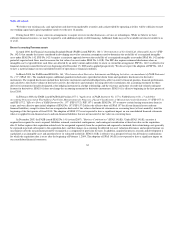
Fiscal Years Ended January 31, 2009 and 2008
Revenues.
Fiscal Year Ended January 31, Variance
(In thousands) 2009 2008 Dollars Percent
Subscription and support $ 984,574 $ 680,581 $ 303,993 45%
Professional services and other 92,195 68,119 24,076 35%
Total revenues $ 1,076,769 $ 748,700 $ 328,069 44%
Total revenues were $1,076.8 million for fiscal 2009, compared to $748.7 million during the same period a year ago, an increase of $328.1 million, or
44 percent. Subscription and support revenues were $984.6 million, or 91 percent of total revenues, for fiscal 2009, compared to $680.6 million, or 91 percent
of total revenues, during the same period a year ago. The increase in subscription and support revenues was due primarily to an increased number of new
customers, additional paying subscriptions from existing customers, and customers who have upgraded. Professional services and other revenues were $92.2
million, or 9 percent of total revenues, for fiscal 2009, compared to $68.1 million, or 9 percent of total revenues, for the same period a year ago. The increase
in professional services and other revenues was due primarily to the higher demand for services from an increased number of paying subscriptions and
customers.
44