Salesforce.com 2008 Annual Report Download - page 63
Download and view the complete annual report
Please find page 63 of the 2008 Salesforce.com annual report below. You can navigate through the pages in the report by either clicking on the pages listed below, or by using the keyword search tool below to find specific information within the annual report.-
 1
1 -
2
-
3
-
4
-
5
-
6
-
7
-
8
-
9
-
10
-
11
-
12
-
13
-
14
-
15
-
16
-
17
-
18
-
19
-
20
-
21
-
22
-
23
-
24
-
25
-
26
-
27
-
28
-
29
-
30
-
31
-
32
-
33
-
34
-
35
-
36
-
37
-
38
-
39
-
40
-
41
-
42
-
43
-
44
-
45
-
46
-
47
-
48
-
49
-
50
-
51
-
52
-
 53
53 -
 54
54 -
 55
55 -
 56
56 -
 57
57 -
 58
58 -
 59
59 -
 60
60 -
 61
61 -
 62
62 -
 63
63 -
 64
64 -
 65
65 -
 66
66 -
 67
67 -
 68
68 -
 69
69 -
 70
70 -
 71
71 -
 72
72 -
 73
73 -
74
-
75
-
76
-
77
-
78
-
79
-
80
-
81
-
82
-
83
-
84
-
85
-
86
-
87
-
88
-
89
-
90
-
91
-
92
-
93
-
94
-
95
-
96
-
97
-
98
-
99
-
100
-
101
-
102
-
103
-
104
-
105
-
106
-
107
-
108
-
109
-
110
-
111
-
112
-
113
-
114
-
115
-
116
-
117
-
118
-
119
-
120
-
121
-
122
-
123
-
124
-
125
-
126
-
127
-
128
-
129
-
130
-
131
-
132
-
133
-
134
-
135
-
136
-
137
-
138
-
139
-
140
-
141
-
142
-
143
-
144
-
145
-
146
-
147
-
148
-
149
-
150
 |
 |

Table of Contents
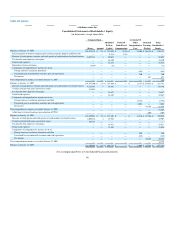
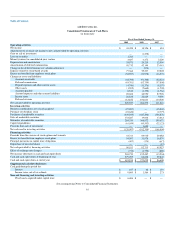
salesforce.com, inc.
Consolidated Statements of Stockholders' Equity
(in thousands, except share data)
Common Stock Additional
Paid-in
Capital
Deferred
Stock-Based
Compensation
Accumulated
Other
Comprehensive
Loss
Retained
Earnings
(Deficit)
Total
Stockholders'
Equity Shares Amount
Balances at January 31, 2006 110,513,576 $ 111 $ 237,010 $ (2,531) $ (2,105) $ (36,114) $ 196,371
Reclassification of deferred compensation resulting from the adoption of SFAS 123R — — (2,531) 2,531 — — —
Exercise of stock options, warrants and stock grants to board members for board services 4,032,132 4 29,691 — — — 29,695
Tax benefits from employee stock plans — — 16,480 — — — 16,480
Stock-based expenses — — 38,858 — — — 38,858
Repurchase of unvested shares (8,148) — (12) — — — (12)
Components of comprehensive income, net of tax:
Foreign currency translation adjustment — — — — (842) — (842)
Unrealized gain on marketable securities and cash equivalents — — — — 760 — 760
Net income — — — — — 481 481
Total comprehensive income, year ended January 31, 2007 — — — — — — 399
Balances at January 31, 2007 114,537,560 $ 115 $ 319,496 $ — $ (2,187) $ (35,633) $ 281,791
Exercise of stock options, warrants and stock grants to board members for board services 4,533,418 4 63,192 — — — 63,196
Vested restricted stock units converted to shares 234,035 — — — — — —
Tax benefits from employee stock plans — — 34,847 — — — 34,847
Stock-based expenses — — 54,267 — — — 54,267
Components of comprehensive income, net of tax:
Foreign currency translation adjustment and other — — — — (2,753) — (2,753)
Unrealized gain on marketable securities and cash equivalents — — — — 2,664 — 2,664
Net income — — — — — 18,356 18,356
Total comprehensive income, year ended January 31, 2008 — — — — — — 18,267
Adjustment to retained earnings upon adoption of FIN 48 (309) (309)
Balances at January 31, 2008 119,305,013 $ 119 $ 471,802 $ — $ (2,276) $ (17,586) $ 452,059
Exercise of stock options and stock grants to board members for board services 3,009,276 4 45,903 — — — 45,907
Vested restricted stock units converted to shares 535,773 — — — — — —
Tax benefits from employee stock plans — — 55,421 — — — 55,421
Stock-based expenses — — 75,598 — — — 75,598
Components of comprehensive income, net of tax:
Foreign currency translation adjustment and other — — — — 260 — 260
Unrealized loss on marketable securities and cash equivalents — — — — (889) — (889)
Net income — — — — — 43,428 43,428
Total comprehensive income, year ended January 31, 2009 — — — — — — 42,799
Balances at January 31, 2009 122,850,062 $ 123 $ 648,724 $ — $ (2,905) $ 25,842 $ 671,784
See accompanying Notes to Consolidated Financial Statements.
60