Salesforce.com 2007 Annual Report Download - page 48
Download and view the complete annual report
Please find page 48 of the 2007 Salesforce.com annual report below. You can navigate through the pages in the report by either clicking on the pages listed below, or by using the keyword search tool below to find specific information within the annual report.-
 1
1 -
2
-
3
-
4
-
5
-
6
-
7
-
8
-
9
-
10
-
11
-
12
-
13
-
14
-
15
-
16
-
17
-
18
-
19
-
20
-
21
-
22
-
23
-
24
-
25
-
26
-
27
-
28
-
29
-
30
-
31
-
32
-
33
-
34
-
35
-
36
-
37
-
 38
38 -
 39
39 -
 40
40 -
 41
41 -
 42
42 -
 43
43 -
 44
44 -
 45
45 -
 46
46 -
 47
47 -
 48
48 -
 49
49 -
 50
50 -
 51
51 -
 52
52 -
 53
53 -
 54
54 -
 55
55 -
 56
56 -
 57
57 -
 58
58 -
59
-
60
-
61
-
62
-
63
-
64
-
65
-
66
-
67
-
68
-
69
-
70
-
71
-
72
-
73
-
74
-
75
-
76
-
77
-
78
-
79
-
80
-
81
-
82
-
83
-
84
-
85
-
86
-
87
-
88
-
89
-
90
-
91
-
92
-
93
-
94
-
95
-
96
-
97
-
98
-
99
 |
 |

Table of Contents
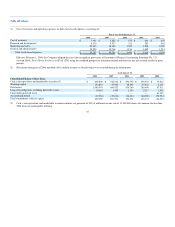
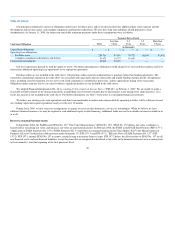
General and Administrative. General and administrative expenses were $116.5 million, or 16 percent of total revenues, during fiscal 2008, compared to
$84.3 million, or 17 percent of total revenues, during the same period a year ago, an increase of $32.2 million. The increase was primarily due to increases in
employee-related costs, stock-based expenses, infrastructure-related costs, professional and outside service costs and a legal settlement. Our general and
administrative headcount increased by 33 percent since January 31, 2007 as we added personnel to support our growth.
Operating Income (Loss). Operating income during fiscal 2008 was $20.3 million and included $55.2 million of stock-based expenses related to SFAS
123R. During the same period a year ago, operating loss was $3.6 million and included $39.2 million of stock-based expenses.
Interest Income. Interest income consists of investment income on cash and marketable securities balances. Interest income was $24.5 million during
fiscal 2008 and was $15.0 million during the same period a year ago. The increase was primarily due to increased marketable securities balances resulting
from the cash generated by operating activities and the proceeds from stock option exercises.
Gain on Sale of Investment. Gain on sale of investment consists of the gain we recorded when we sold our shares in a privately held professional service
corporation. The gain was $1.3 million for the fiscal 2008,
Provision for Income Taxes. We recorded a provision for income taxes of $23.4 million during fiscal 2008, compared to a provision for income taxes of
$9.8 million during the same period a year ago.
Our effective tax rate decreased to 51 percent for fiscal 2008 compared to 78 percent for the same period a year ago.
The fiscal 2008 provision as a percentage of income before provision for income taxes and minority interest was significantly lower than for the same
period a year ago primarily due to a reduced proportion of foreign losses for which no tax benefit can be realized. The total income tax benefit recognized in
the accompanying consolidated statement of operations related to SFAS 123R was $18.5 million for the current fiscal year. See Note 7 "Income Taxes" to the
Notes to the Consolidated Financial Statements for our reconciliation of income taxes at the statutory federal rate to the provision for income taxes.
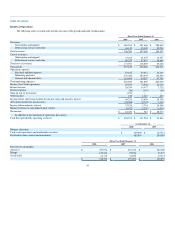
Fiscal Years Ended January 31, 2007 and 2006
Revenues. Total revenues were $497.1 million for fiscal 2007, compared to $309.9 million during the same period a year ago, an increase of $187.2
million, or 60 percent. Subscription and support revenues were $451.7 million, or 91 percent of total revenues, for fiscal 2007, compared to $280.7 million, or
91 percent of total revenues, during the same period a year ago. The increase in subscription and support revenues was due primarily to the increase in the
number of paying subscriptions to approximately 646,000 as of January 31, 2007 from approximately 393,000 as of January 31, 2006. Professional services
and other revenues were $45.4 million, or 9 percent of total revenues, for fiscal 2007, compared to $29.2 million, or 9 percent of total revenues, for the same
period a year ago. The increase in professional services and other revenues was due primarily to the higher demand for services from an increased number of
paying subscriptions and customers.
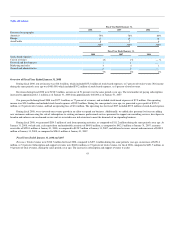
Revenues in Europe and Asia Pacific accounted for $109.5 million, or 22 percent of total revenues, for fiscal 2007, compared to $62.8 million, or 20
percent of total revenues, during the same period a year ago, an increase of $46.7 million, or 74 percent. The increase in revenues outside of the Americas was
the result of our efforts to expand internationally.
Cost of Revenues. Cost of revenues was $118.9 million, or 24 percent of total revenues, during fiscal 2007, compared to $69.1 million, or 22 percent of
total revenues, during the same period a year ago, an increase of
45