Salesforce.com 2007 Annual Report Download - page 37
Download and view the complete annual report
Please find page 37 of the 2007 Salesforce.com annual report below. You can navigate through the pages in the report by either clicking on the pages listed below, or by using the keyword search tool below to find specific information within the annual report.-
 1
1 -
2
-
3
-
4
-
5
-
6
-
7
-
8
-
9
-
10
-
11
-
12
-
13
-
14
-
15
-
16
-
17
-
18
-
19
-
20
-
21
-
22
-
23
-
24
-
25
-
26
-
 27
27 -
 28
28 -
 29
29 -
 30
30 -
 31
31 -
 32
32 -
 33
33 -
 34
34 -
 35
35 -
 36
36 -
 37
37 -
 38
38 -
 39
39 -
 40
40 -
 41
41 -
 42
42 -
 43
43 -
 44
44 -
 45
45 -
 46
46 -
 47
47 -
48
-
49
-
50
-
51
-
52
-
53
-
54
-
55
-
56
-
57
-
58
-
59
-
60
-
61
-
62
-
63
-
64
-
65
-
66
-
67
-
68
-
69
-
70
-
71
-
72
-
73
-
74
-
75
-
76
-
77
-
78
-
79
-
80
-
81
-
82
-
83
-
84
-
85
-
86
-
87
-
88
-
89
-
90
-
91
-
92
-
93
-
94
-
95
-
96
-
97
-
98
-
99
 |
 |

Table of Contents
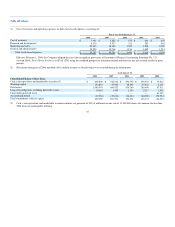
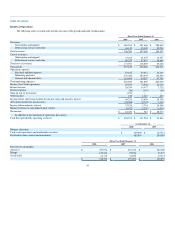
ITEM 6. SELECTED FINANCIAL DATA
The following selected consolidated financial data should be read in conjunction with our audited consolidated financial statements and related notes
thereto and with Management's Discussion and Analysis of Financial Condition and Results of Operation, which are included elsewhere in this Form 10-K.
The consolidated statement of operations data for fiscal 2008, 2007 and 2006, and the selected consolidated balance sheet data as of January 31, 2008 and
2007 are derived from, and are qualified by reference to, the audited consolidated financial statements and are included in this Form 10-K. The consolidated
statement of operations data for fiscal 2005 and 2004 and the consolidated balance sheet data as of January 31, 2006, 2005 and 2004 are derived from audited
consolidated financial statements which are not included in this Form 10-K.
(in thousands, except per share data)
Fiscal Year Ended January 31,
2008 2007 2006 2005 2004
Consolidated Statement of Operations:
Revenues:
Subscription and support $ 680,581 $ 451,660 $ 280,639 $ 157,977 $ 85,796
Professional services and other 68,119 45,438 29,218 18,398 10,227
Total revenues 748,700 497,098 309,857 176,375 96,023
Cost of revenues (1):
Subscription and support 91,268 61,457 34,457 12,727 7,782
Professional services and other 80,323 57,433 34,669 20,727 9,491
Total cost of revenues 171,591 118,890 69,126 33,454 17,273
Gross profit 577,109 378,208 240,731 142,921 78,750
Operating expenses (1):
Research and development 63,812 44,614 23,330 9,822 6,962
Marketing and sales 376,480 252,935 149,598 96,311 54,600
General and administrative 116,508 84,257 47,986 30,268 16,915
Lease recovery — — (285) — (3,445)
Total operating expenses 556,800 381,806 220,629 136,401 75,032
Income (loss) from operations 20,309 (3,598) 20,102 6,520 3,718
Interest income 24,539 14,977 7,726 2,658 379
Interest expense (46) (193) (69) (37) (22)
Gain on sale of investment 1,272 — — — —
Other income 139 1,310 439 12 164
Income before (provision) benefit for income taxes and minority interest 46,213 12,496 28,198 9,153 4,239
(Provision) benefit for income taxes (23,385) (9,795) 1,310 (1,217) (541)
Income before minority interest 22,828 2,701 29,508 7,936 3,698
Minority interest in consolidated joint venture (4,472) (2,220) (1,034) (590) (184)
Net income (2) $ 18,356 $ 481 $ 28,474 $ 7,346 $ 3,514
Net income per share:
Basic $ 0.16 $ 0.00 $ 0.27 $ 0.10 $ 0.12
Diluted 0.15 0.00 0.24 0.07 0.04
Weighted-average shares used in computing per share amounts:
Basic 116,840 112,386 107,274 75,503 29,605
Diluted 122,422 120,154 118,737 110,874 95,409
34