Salesforce.com 2007 Annual Report Download - page 38
Download and view the complete annual report
Please find page 38 of the 2007 Salesforce.com annual report below. You can navigate through the pages in the report by either clicking on the pages listed below, or by using the keyword search tool below to find specific information within the annual report.-
 1
1 -
2
-
3
-
4
-
5
-
6
-
7
-
8
-
9
-
10
-
11
-
12
-
13
-
14
-
15
-
16
-
17
-
18
-
19
-
20
-
21
-
22
-
23
-
24
-
25
-
26
-
27
-
 28
28 -
 29
29 -
 30
30 -
 31
31 -
 32
32 -
 33
33 -
 34
34 -
 35
35 -
 36
36 -
 37
37 -
 38
38 -
 39
39 -
 40
40 -
 41
41 -
 42
42 -
 43
43 -
 44
44 -
 45
45 -
 46
46 -
 47
47 -
 48
48 -
49
-
50
-
51
-
52
-
53
-
54
-
55
-
56
-
57
-
58
-
59
-
60
-
61
-
62
-
63
-
64
-
65
-
66
-
67
-
68
-
69
-
70
-
71
-
72
-
73
-
74
-
75
-
76
-
77
-
78
-
79
-
80
-
81
-
82
-
83
-
84
-
85
-
86
-
87
-
88
-
89
-
90
-
91
-
92
-
93
-
94
-
95
-
96
-
97
-
98
-
99
 |
 |

Table of Contents
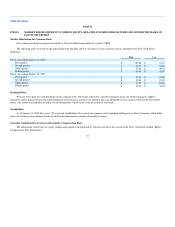
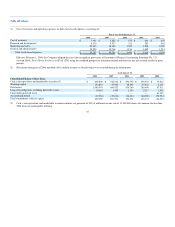
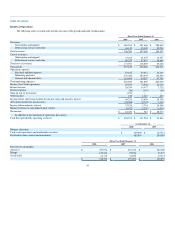
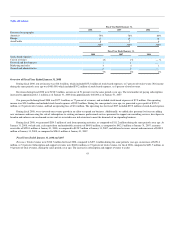
(1) Cost of revenues and operating expenses include stock-based expenses, consisting of:
Fiscal Year Ended January 31,
2008 2007 2006 2005 2004
Cost of revenues $ 7,926 $ 5,522 $ 575 $ 634 $ 655
Research and development 6,336 4,523 332 282 462
Marketing and sales 25,423 18,392 1,325 1,296 2,029
General and administrative 15,522 10,768 1,216 1,402 1,213
Total stock-based expenses $ 55,207 $ 39,205 $ 3,448 $ 3,614 $ 4,359
Effective February 1, 2006, the Company adopted the fair value recognition provisions of Statement of Financial Accounting Standards No. 123
(revised 2004), Share-Based Payment, or SFAS 123R, using the modified prospective transition method and therefore has not restated results for prior
periods.
(2) Net income during fiscal 2006 included a $6.8 million income tax benefit which was recorded during the third quarter.
As of January 31,
2008 2007 2006 2005 2004
Consolidated Balance Sheet Data:
Cash, cash equivalents and marketable securities (3) $ 669,800 $ 412,512 $ 296,792 $ 205,938 $ 35,812
Working capital 134,894 45,905 68,592 47,044 4,140
Total assets 1,089,593 664,832 434,749 280,499 87,511
Long-term obligations excluding deferred revenue 10,601 1,408 1,339 2,317 1,830
Convertible preferred stock — — — — 61,137
Accumulated deficit (17,586) (35,633) (36,114) (64,588) (71,934)
Total stockholders' (deficit) equity 452,059 281,791 196,371 145,131 (46,237)
(3) Cash, cash equivalents and marketable securities includes net proceeds of $113.8 million from our sale of 11,500,000 shares of common stock in June
2004 from our initial public offering.
35