Salesforce.com 2007 Annual Report Download - page 44
Download and view the complete annual report
Please find page 44 of the 2007 Salesforce.com annual report below. You can navigate through the pages in the report by either clicking on the pages listed below, or by using the keyword search tool below to find specific information within the annual report.-
 1
1 -
2
-
3
-
4
-
5
-
6
-
7
-
8
-
9
-
10
-
11
-
12
-
13
-
14
-
15
-
16
-
17
-
18
-
19
-
20
-
21
-
22
-
23
-
24
-
25
-
26
-
27
-
28
-
29
-
30
-
31
-
32
-
33
-
 34
34 -
 35
35 -
 36
36 -
 37
37 -
 38
38 -
 39
39 -
 40
40 -
 41
41 -
 42
42 -
 43
43 -
 44
44 -
 45
45 -
 46
46 -
 47
47 -
 48
48 -
 49
49 -
 50
50 -
 51
51 -
 52
52 -
 53
53 -
 54
54 -
55
-
56
-
57
-
58
-
59
-
60
-
61
-
62
-
63
-
64
-
65
-
66
-
67
-
68
-
69
-
70
-
71
-
72
-
73
-
74
-
75
-
76
-
77
-
78
-
79
-
80
-
81
-
82
-
83
-
84
-
85
-
86
-
87
-
88
-
89
-
90
-
91
-
92
-
93
-
94
-
95
-
96
-
97
-
98
-
99
 |
 |

Table of Contents
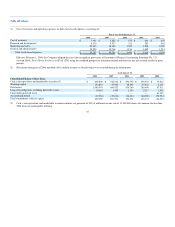
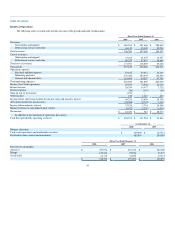
Results of Operations
The following tables set forth selected data for each of the periods indicated (in thousands).
Fiscal Year Ended January 31,
2008 2007 2006
Revenues:
Subscription and support $ 680,581 $ 451,660 $ 280,639
Professional services and other 68,119 45,438 29,218
Total revenues 748,700 497,098 309,857
Cost of revenues:
Subscription and support 91,268 61,457 34,457
Professional services and other 80,323 57,433 34,669
Total cost of revenues 171,591 118,890 69,126
Gross profit 577,109 378,208 240,731
Operating expenses:
Research and development 63,812 44,614 23,330
Marketing and sales 376,480 252,935 149,598
General and administrative 116,508 84,257 47,701
Total operating expenses 556,800 381,806 220,629
Income (loss) from operations 20,309 (3,598) 20,102
Interest income 24,539 14,977 7,726
Interest expense (46) (193) (69)
Gain on sale of investment 1,272 — —
Other income 139 1,310 439
Income before (provision) benefit for income taxes and minority interest 46,213 12,496 28,198
(Provision) benefit for income taxes (23,385) (9,795) 1,310
Income before minority interest 22,828 2,701 29,508
Minority interest in consolidated joint venture (4,472) (2,220) (1,034)
Net income $ 18,356 $ 481 $ 28,474
In addition to the statement of operations data above:
Cash flow provided by operating activities $ 204,275 $ 111,224 $ 95,893
As of January 31,
2008 2007
Balance sheet data:
Cash, cash equivalents and marketable securities $ 669,800 $ 412,512
Deferred revenue, current and noncurrent 480,894 284,063
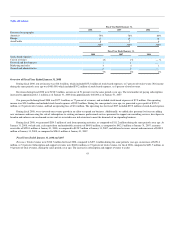
Fiscal Year Ended January 31,
2008 2007 2006
Revenues by geography:
Americas $ 557,976 $ 387,570 $ 247,009
Europe 127,010 75,026 43,577
Asia Pacific 63,714 34,502 19,271
$ 748,700 $ 497,098 $ 309,857
41