Salesforce.com 2005 Annual Report Download - page 56
Download and view the complete annual report
Please find page 56 of the 2005 Salesforce.com annual report below. You can navigate through the pages in the report by either clicking on the pages listed below, or by using the keyword search tool below to find specific information within the annual report.-
 1
1 -
2
-
3
-
4
-
5
-
6
-
7
-
8
-
9
-
10
-
11
-
12
-
13
-
14
-
15
-
16
-
17
-
18
-
19
-
20
-
21
-
22
-
23
-
24
-
25
-
26
-
27
-
28
-
29
-
30
-
31
-
32
-
33
-
34
-
35
-
36
-
37
-
38
-
39
-
40
-
41
-
42
-
43
-
44
-
45
-
 46
46 -
 47
47 -
 48
48 -
 49
49 -
 50
50 -
 51
51 -
 52
52 -
 53
53 -
 54
54 -
 55
55 -
 56
56 -
 57
57 -
 58
58 -
 59
59 -
 60
60 -
 61
61 -
 62
62 -
 63
63 -
 64
64 -
 65
65 -
 66
66 -
67
-
68
-
69
-
70
-
71
-
72
-
73
-
74
-
75
-
76
-
77
-
78
-
79
-
80
-
81
-
82
-
83
-
84
-
85
-
86
-
87
-
88
-
89
-
90
-
91
-
92
-
93
-
94
-
95
-
96
-
97
-
98
-
99
-
100
-
101
-
102
-
103
-
104
-
105
-
106
-
107
-
108
-
109
-
110
-
111
-
112
-
113
-
114
-
115
-
116
-
117
-
118
-
119
-
120
-
121
-
122
-
123
-
124
-
125
-
126
-
127
-
128
-
129
-
130
-
131
-
132
-
133
-
134
-
135
-
136
-
137
-
138
-
139
-
140
-
141
-
142
-
143
-
144
-
145
-
146
-
147
-
148
-
149
-
150
-
151
-
152
-
153
-
154
-
155
-
156
-
157
-
158
-
159
-
160
-
161
-
162
-
163
-
164
-
165
-
166
-
167
-
168
-
169
-
170
-
171
-
172
-
173
-
174
-
175
-
176
-
177
-
178
-
179
-
180
-
181
-
182
-
183
-
184
-
185
-
186
-
187
-
188
-
189
-
190
-
191
-
192
-
193
-
194
-
195
-
196
-
197
-
198
-
199
-
200
-
201
-
202
-
203
-
204
-
205
-
206
-
207
-
208
-
209
-
210
-
211
-
212
-
213
-
214
-
215
-
216
-
217
-
218
-
219
-
220
-
221
-
222
-
223
-
224
-
225
-
226
-
227
-
228
-
229
-
230
-
231
-
232
-
233
-
234
-
235
-
236
-
237
-
238
 |
 |

Table of Contents
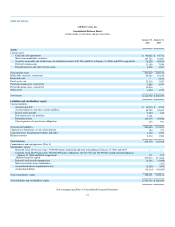
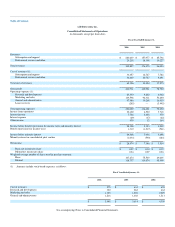
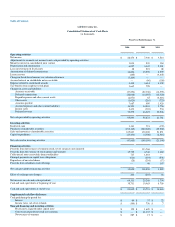
salesforce.com, inc.
Consolidated Statements of Operations
(in thousands, except per share data)
Fiscal Year Ended January 31,
2006
2005
2004
Revenues:
Subscription and support $ 280,639 $ 157,977 $ 85,796
Professional services and other 29,218 18,398 10,227
Total revenues 309,857 176,375 96,023
Cost of revenues (1):
Subscription and support 34,457 12,727 7,782
Professional services and other 34,669 20,727 9,491
Total cost of revenues 69,126 33,454 17,273
Gross profit 240,731 142,921 78,750
Operating expenses (1):
Research and development 23,330 9,822 6,962
Marketing and sales 149,598 96,311 54,600
General and administrative 47,986 30,268 16,915
Lease recovery (285) — (3,445)
Total operating expenses 220,629 136,401 75,032
Income from operations 20,102 6,520 3,718
Interest income 7,726 2,658 379
Interest expense (69) (37) (22)
Other income 439 12 164
Income before benefit (provision) for income taxes and minority interest 28,198 9,153 4,239
Benefit (provision) for income taxes 1,310 (1,217) (541)
Income before minority interest 29,508 7,936 3,698
Minority interest in consolidated joint venture (1,034) (590) (184)
Net income $ 28,474 $ 7,346 $ 3,514
Basic net income per share $ 0.27 $ 0.10 $ 0.12
Diluted net income per share 0.24 0.07 0.04
Weighted-average number of shares used in per share amounts:
Basic 107,274 75,503 29,605
Diluted 118,737 110,874 95,409
(1) Amounts include stock-based expenses, as follows:
Fiscal Year Ended January 31,
2006
2005
2004
Cost of revenues $ 575 $ 634 $ 655
Research and development 332 282 462
Marketing and sales 1,325 1,296 2,029
General and administrative 1,216 1,402 1,213
$ 3,448 $ 3,614 $ 4,359
See accompanying Notes to Consolidated Financial Statements.