Salesforce.com 2005 Annual Report Download - page 38
Download and view the complete annual report
Please find page 38 of the 2005 Salesforce.com annual report below. You can navigate through the pages in the report by either clicking on the pages listed below, or by using the keyword search tool below to find specific information within the annual report.-
 1
1 -
2
-
3
-
4
-
5
-
6
-
7
-
8
-
9
-
10
-
11
-
12
-
13
-
14
-
15
-
16
-
17
-
18
-
19
-
20
-
21
-
22
-
23
-
24
-
25
-
26
-
27
-
 28
28 -
 29
29 -
 30
30 -
 31
31 -
 32
32 -
 33
33 -
 34
34 -
 35
35 -
 36
36 -
 37
37 -
 38
38 -
 39
39 -
 40
40 -
 41
41 -
 42
42 -
 43
43 -
 44
44 -
 45
45 -
 46
46 -
 47
47 -
 48
48 -
49
-
50
-
51
-
52
-
53
-
54
-
55
-
56
-
57
-
58
-
59
-
60
-
61
-
62
-
63
-
64
-
65
-
66
-
67
-
68
-
69
-
70
-
71
-
72
-
73
-
74
-
75
-
76
-
77
-
78
-
79
-
80
-
81
-
82
-
83
-
84
-
85
-
86
-
87
-
88
-
89
-
90
-
91
-
92
-
93
-
94
-
95
-
96
-
97
-
98
-
99
-
100
-
101
-
102
-
103
-
104
-
105
-
106
-
107
-
108
-
109
-
110
-
111
-
112
-
113
-
114
-
115
-
116
-
117
-
118
-
119
-
120
-
121
-
122
-
123
-
124
-
125
-
126
-
127
-
128
-
129
-
130
-
131
-
132
-
133
-
134
-
135
-
136
-
137
-
138
-
139
-
140
-
141
-
142
-
143
-
144
-
145
-
146
-
147
-
148
-
149
-
150
-
151
-
152
-
153
-
154
-
155
-
156
-
157
-
158
-
159
-
160
-
161
-
162
-
163
-
164
-
165
-
166
-
167
-
168
-
169
-
170
-
171
-
172
-
173
-
174
-
175
-
176
-
177
-
178
-
179
-
180
-
181
-
182
-
183
-
184
-
185
-
186
-
187
-
188
-
189
-
190
-
191
-
192
-
193
-
194
-
195
-
196
-
197
-
198
-
199
-
200
-
201
-
202
-
203
-
204
-
205
-
206
-
207
-
208
-
209
-
210
-
211
-
212
-
213
-
214
-
215
-
216
-
217
-
218
-
219
-
220
-
221
-
222
-
223
-
224
-
225
-
226
-
227
-
228
-
229
-
230
-
231
-
232
-
233
-
234
-
235
-
236
-
237
-
238
 |
 |

Table of Contents
Fiscal Year
Our fiscal year ends on January 31. References to fiscal 2006, for example, refer to the fiscal year ended January 31, 2006.
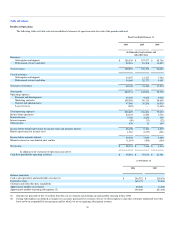
Sources of Revenues
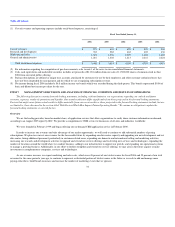
We derive our revenues from two sources: (1) subscription revenues, which are comprised of subscription fees from customers accessing our on-
demand application service, and from customers purchasing additional support beyond the standard support that is included in the basic subscription fee; and
(2) related professional services and other revenues. Other revenues consist primarily of training fees. Subscription and support revenues accounted for 91
percent of our total revenues during fiscal 2006 and 90 percent during the same period a year ago. Subscription revenues are driven primarily by the number
of paying subscribers of our service and the subscription price of our service. None of our customers accounted for more than 5 percent of our revenues during
fiscal 2006 and 2005.
Subscription and support revenues are recognized ratably over the contract terms beginning on the commencement dates of each contract. The typical
subscription and support term is 12 to 24 months, although terms range from one to 60 months. Our subscription and support contracts are noncancelable,
though customers typically have the right to terminate their contracts for cause if we materially fail to perform. We generally invoice our customers in
advance, in annual or quarterly installments, and typical payment terms provide that our customers pay us within 30 days of invoice. Amounts that have been
invoiced are recorded in accounts receivable and in deferred revenue, or in revenue depending on whether the revenue recognition criteria have been met. In
general, we collect our billings in advance of the subscription service period.
Professional services and other revenues consist of fees associated with consulting and implementation services and training. Our consulting and
implementation engagements are typically billed on a time and materials basis. We also offer a number of classes on implementing, using and administering
our service that are billed on a per person, per class basis. Our typical payment terms provide that our customers pay us within 30 days of invoice.
Cost of Revenues and Operating Expenses
Cost of Revenues. Cost of subscription and support revenues primarily consists of expenses related to hosting our service and providing support, the
costs of additional data center capacity, depreciation or operating lease expense associated with computer equipment, costs associated with website
development activities, allocated overhead and amortization expense associated with capitalized software. To date, the amortization expense associated with
capitalized software has not been material to our cost of revenues. We allocate overhead such as rent and occupancy charges, employee benefit costs and taxes
to all departments based on headcount. As such, general overhead expenses are reflected in each cost of revenue and operating expense category. Cost of
professional services and other revenues consists primarily of employee-related costs associated with these services, the cost of subcontractors and allocated
overhead. The cost associated with providing professional services is significantly higher as a percentage of revenue than for our on-demand subscription
service due to the labor costs associated with providing professional services.
To the extent that our customer base grows, we intend to continue to invest additional resources in our on-demand application service and in our
consulting services. The timing of these additional expenses will affect our cost of revenues, both in terms of absolute dollars and as a percentage of revenues,
in a particular quarterly period. For example, we plan to increase the number of employees who are fully dedicated to consulting services. We have also
obtained additional data center capacity on the west and east coasts of the United States. We expect the annual cost of these resources to be significant.
Research and Development. Research and development expenses consist primarily of salaries and related expenses, the costs of upgrading our new
development and test data center and allocated overhead. We have
35