Porsche 2013 Annual Report Download - page 130
Download and view the complete annual report
Please find page 130 of the 2013 Porsche annual report below. You can navigate through the pages in the report by either clicking on the pages listed below, or by using the keyword search tool below to find specific information within the annual report.
128 // ANNUAL REPORT PORSCHE AG 2013
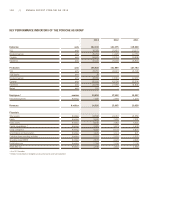
KEY PERFORMANCE INDICATORS OF THE PORSCHE AG GROUP
2013 2012 2011
Deliveries units 162,145 141,075 118,868
911 units 30,205 25,457 19,377
Boxster/Cayman units 25,704 11,825 12,753
Cayenne units 84,041 74,763 59,898
Panamera units 22,032 29,030 26,840
Production units 165,808 151,999 127,793
911 units 29,751 28,419 21,748
918 Spyder units 35 – –
Boxster/Cayman units 28,996 13,316 12,207
Cayenne units 81,916 83,208 62,004
Panamera units 24,798 27,056 31,834
Macan units 312 – –
Employees 1) number 19,456 17,502 15,307
Personnel expenses € million 1,865 1,658 1,349
Revenues € million 14,326 13,865 10,928
Financials
Total assets € million 24,560 22,747 21,556
Equity € million 9,039 7,402 7,001
Fixed assets € million 8,539 7,083 5,944
Capital expenditures 2) € million 2,236 1,873 1,678
Costs of material € million 8,282 8,124 6,822
Amortization and depreciation € million 1,415 1,114 871
Cash flow from operating activities € million 2,917 2,692 2,522
Operating result (EBIT) € million 2,579 2,429 2,045
Profit before tax € million 2,784 2,638 2,108
Profit after tax € million 1,939 1,833 1,460
1) As of 31 December.
2) Relates to investments in intangible assets and property, plant and equipment.


