Porsche 2013 Annual Report Download - page 117
Download and view the complete annual report
Please find page 117 of the 2013 Porsche annual report below. You can navigate through the pages in the report by either clicking on the pages listed below, or by using the keyword search tool below to find specific information within the annual report.-
 1
1 -
2
-
3
-
4
-
5
-
6
-
7
-
8
-
9
-
10
-
11
-
12
-
13
-
14
-
15
-
16
-
17
-
18
-
19
-
20
-
21
-
22
-
23
-
24
-
25
-
26
-
27
-
28
-
29
-
30
-
31
-
32
-
33
-
34
-
35
-
36
-
37
-
38
-
39
-
40
-
41
-
42
-
43
-
44
-
45
-
46
-
47
-
48
-
49
-
50
-
51
-
52
-
53
-
54
-
55
-
56
-
57
-
58
-
59
-
60
-
61
-
62
-
63
-
64
-
65
-
66
-
67
-
68
-
69
-
70
-
71
-
72
-
73
-
74
-
75
-
76
-
77
-
78
-
79
-
80
-
81
-
82
-
83
-
84
-
85
-
86
-
87
-
88
-
89
-
90
-
91
-
92
-
93
-
94
-
95
-
96
-
97
-
98
-
99
-
100
-
101
-
102
-
103
-
104
-
105
-
106
-
 107
107 -
 108
108 -
 109
109 -
 110
110 -
 111
111 -
 112
112 -
 113
113 -
 114
114 -
 115
115 -
 116
116 -
 117
117 -
 118
118 -
 119
119 -
 120
120 -
 121
121 -
 122
122 -
 123
123 -
 124
124 -
 125
125 -
 126
126 -
 127
127 -
128
-
129
-
130
-
131
-
132
 |
 |
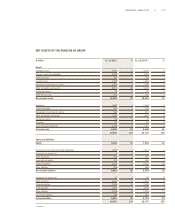
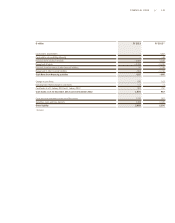
Amortization and depreciation across all functions increased
to 1,415 million euro compared to 1,114 million euro in
the prior year. This increase mainly pertains to amortization
of development costs and depreciation of tools that are
disclosed under other equipment, furniture and fixtures.
Depreciation of leased assets likewise increased significantly.
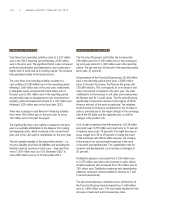
Other operating income increased from 547 million euro
to 610 million euro. The increase is mainly attributable to
increased income from the reversal of provisions and accru-
als. Other operating expenses decreased from 461 million
euro to 351 million euro. The decrease mainly results from
lower expenses in connection with currency options.
Operating profit came to 2,579 million euro, increasing by
150 million euro in comparison to the prior year.
The financial result comes to 205 million euro (prior year:
209 million euro). Finance costs fell due to the improvement
in average net liquidity and the improved refinancing terms.
However, the decrease was also compensated for by
increased expenses (prior year: income) from the fair-value
measurement of derivative exchange rate and interest rate
hedges that are not included in hedge accounting.
The healthy cost structure and the sustainably high earnings
power of the group are also reflected in the key performance
indicators. The Porsche AG group achieved a return on sales
of 18 percent in the past fiscal year (prior year: 18 percent).
The return on sales net of tax was 19 percent (prior year:
19 percent). The return on capital, defined as the ratio of
operating result net of tax to average invested assets of
the automotive division, was 30 percent (prior year: 33 per-
cent). The return on equity net of tax was 24 percent (prior
year: 25 percent).
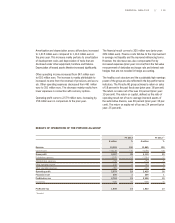
FY 2013 FY 2012 1)
€ million % € million %
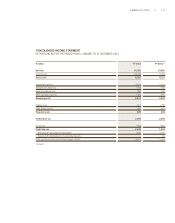
Revenue 14,326 100 13,865 100
Cost of sales – 10,139 – 71 – 9,755 – 70
Gross prot 4,187 29 4,110 30
Distribution expenses – 1,075 – 7 – 1,014 – 7
Administrative expenses – 792 – 5 – 753 – 5
Other operating income 610 4 547 4
Other operating expenses – 351 – 3 – 461 – 4
Operating prot 2,579 18 2,429 18
Financial result 205 1 209 1
Prot before tax 2,784 19 2,638 19
Income tax – 845 – 5 – 805 – 6
Prot after tax 1,939 14 1,833 13
1) Restated.
RESULTS OF OPERATIONS OF THE PORSCHE AG GROUP
FINANCIAL ANALYSIS // 115